Overview
Trellis is a financial confidence app that connects to your bank, builds a personalized household budget, and then actively helps you save through meal planning, shopping lists priced at real stores, local deals, pantry tracking, savings goals, and a financial agent. It runs on both Android and iOS from a single Kotlin Multiplatform codebase.
This post covers how it's built: the tech stack, the architecture, and the RevenueCat integration that powers the subscription model.
How It Works
Budgeting
When a user connects their bank through Plaid, transactions sync and get classified into nine budget categories: Housing, Utilities, Groceries, Eating Out, Kids, Transport, Fun, Subscriptions, and Health. Classification follows a multi-step pipeline. First, merchant overrides handle known edge cases where Plaid miscategorizes (utility companies coded as general services, for example). Then Plaid's detailed category codes get remapped through over 40 explicit mappings, like FOOD_AND_DRINK:FOOD_AND_DRINK_GROCERIES to Groceries. If the detailed code doesn't match, a broader primary category map catches the rest. User-defined category rules take priority over all of these: if you recategorize "Target" as Groceries once, it stays that way. For anything still unmapped, a keyword matching step checks the transaction description for patterns like "SUBSCRIPTION", "INSURANCE", or specific merchant names. Finally, anything that makes it through all of these gets sent to AI for classification with strict category enforcement.
| Plaid Category | Trellis Category |
|---|---|
| FOOD_AND_DRINK: GROCERIES | Groceries |
| FOOD_AND_DRINK: RESTAURANT, FAST_FOOD, COFFEE, BAR | Eating Out |
| RENT_AND_UTILITIES: RENT, MORTGAGE | Housing |
| RENT_AND_UTILITIES: ELECTRIC, GAS, WATER, INTERNET | Utilities |
| TRANSPORTATION: GAS, PARKING, TOLLS, PUBLIC_TRANSIT | Transport |
| GENERAL_SERVICES: CHILDCARE, EDUCATION | Kids |
| ENTERTAINMENT, RECREATION, TRAVEL | Fun |
| MEDICAL, PERSONAL_CARE | Health |
| Any with "SUBSCRIPTION" in name | Subscriptions |
Once transactions are categorized, the budget generation algorithm takes the user's income, location, and household size and builds a personalized budget. Spending is annualized to monthly, then compared against regional averages sourced from a cost-of-living database covering all 50 states with metro-area granularity where available. Food costs are scaled using USDA moderate-cost food plan multipliers: +80% per additional adult, +50% per child, +35% per infant, then split 70/30 into groceries and eating out based on BLS consumer expenditure data. Childcare estimates pull from state-level data, and transport scales by household size.
For essential categories where the user has zero transactions on their linked accounts (groceries paid with cash, rent via bank transfer, etc.), the system injects regional estimates as phantom categories. These show up in the budget with an "Estimated" label and explanation, so the user knows the number is a placeholder based on their area rather than tracked spending. This prevents the common problem of a $0 grocery budget for someone who just happens to buy groceries with a different card.
The algorithm prioritizes cuts by category weight. Eating out and entertainment carry a 3x weight, meaning they get reduced first. Transport is 1.5x. Groceries and kids carry lower weights and only get touched if spending is significantly above the regional floor. Every suggested target has a minimum, so the app never recommends an unrealistic grocery budget just to make the numbers work. If the user's income is below their total spending, the system allocates cuts across categories using these weights until the budget balances.
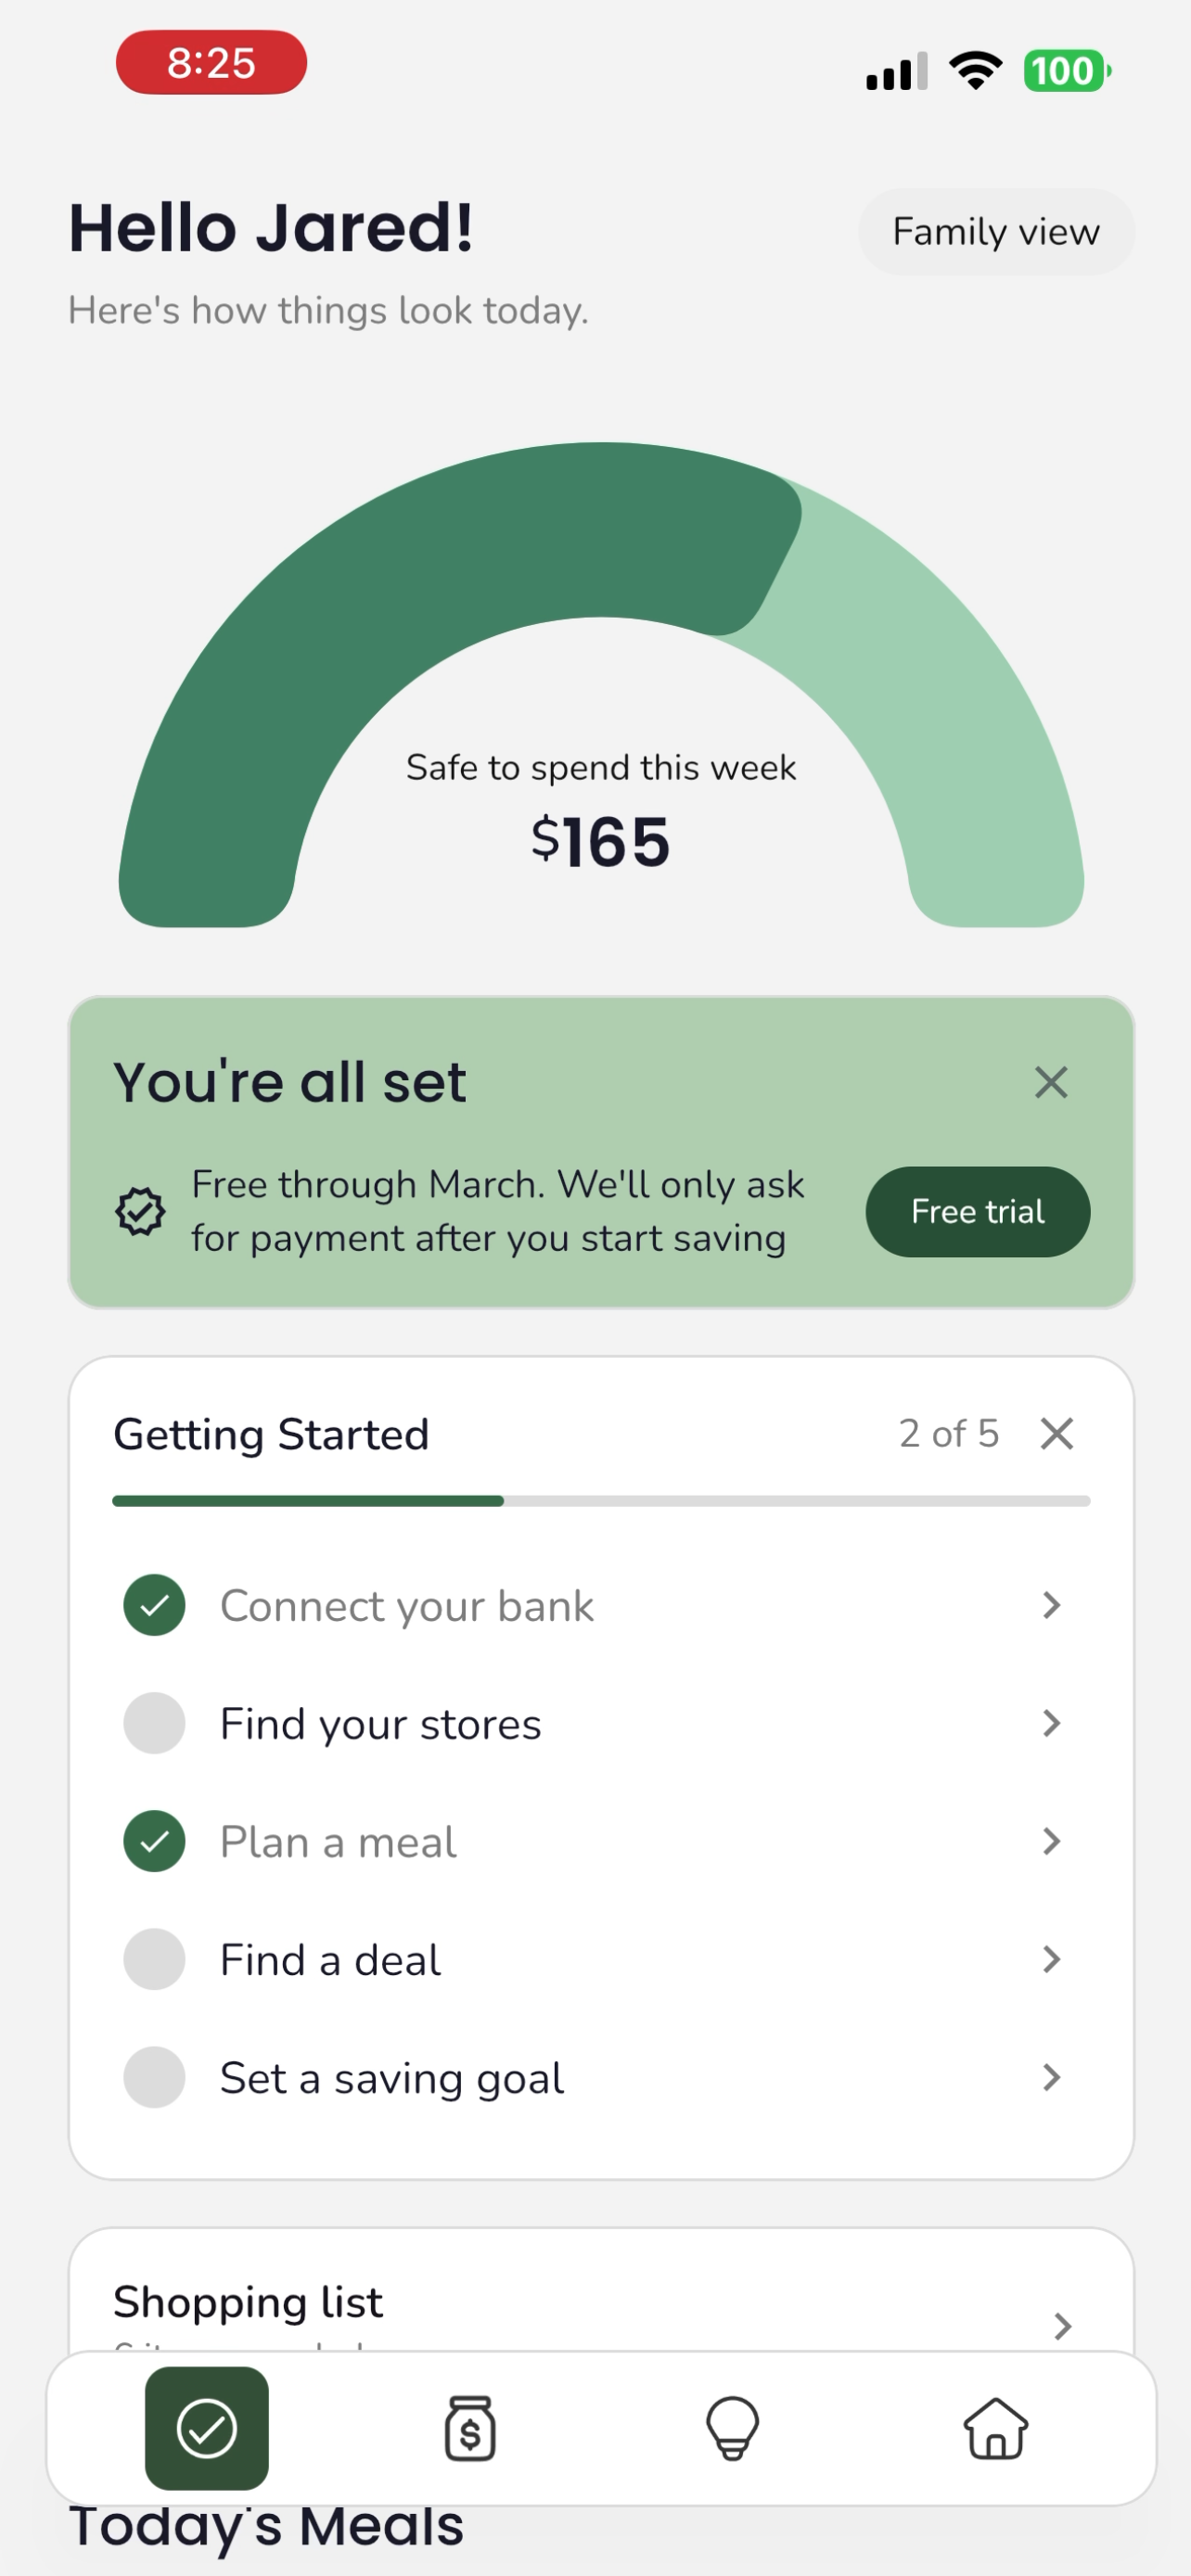
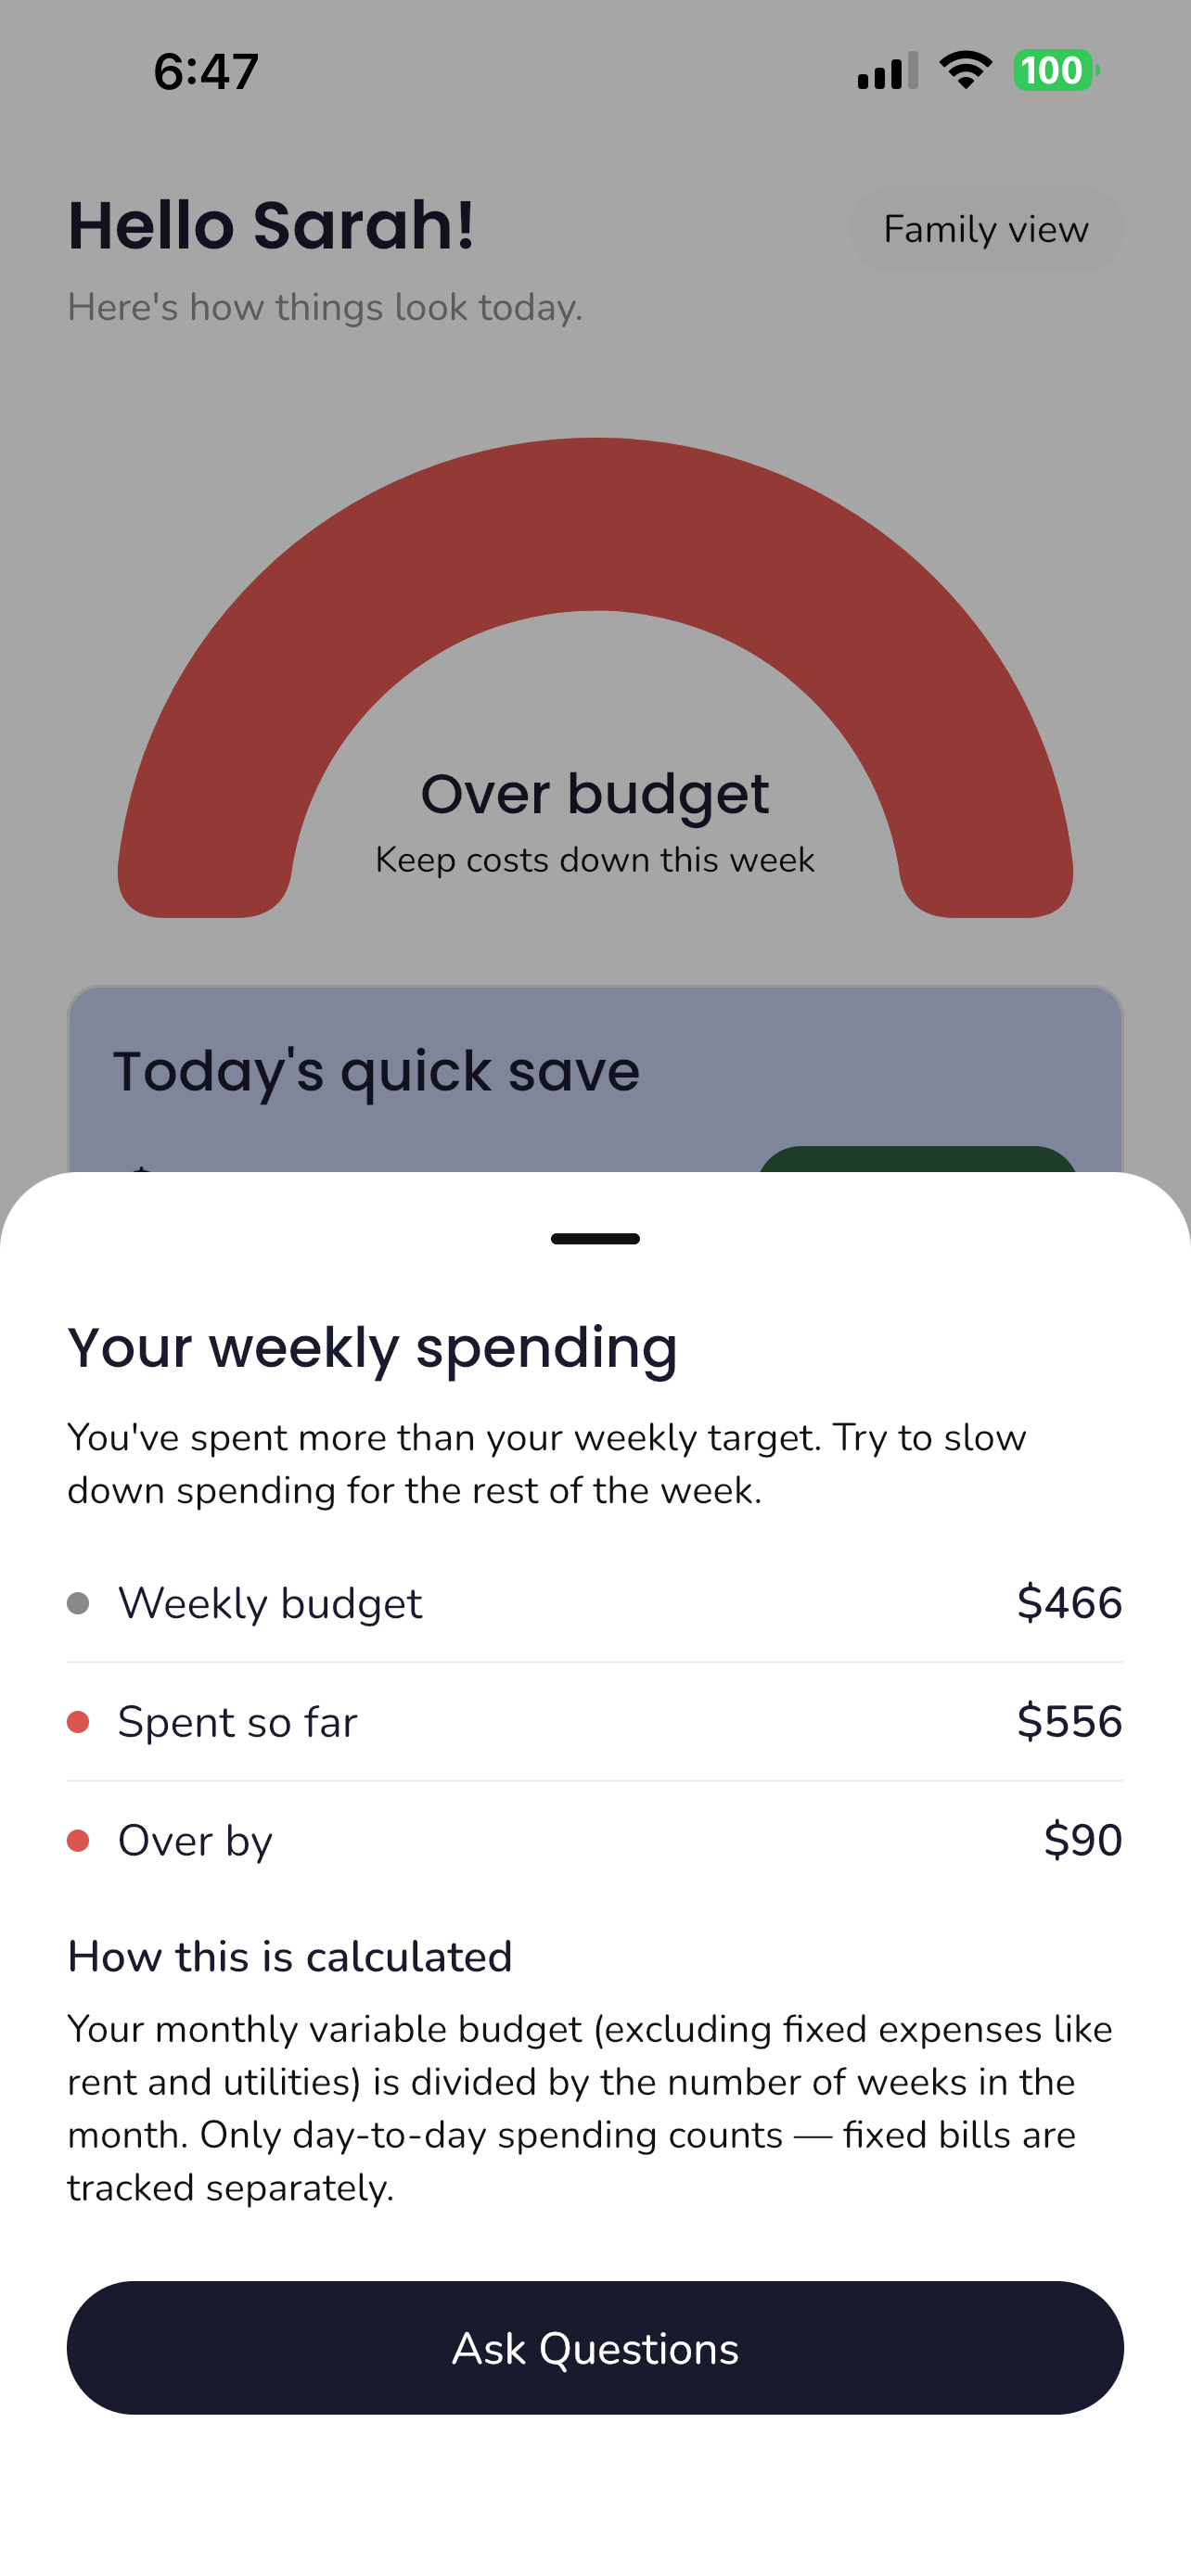
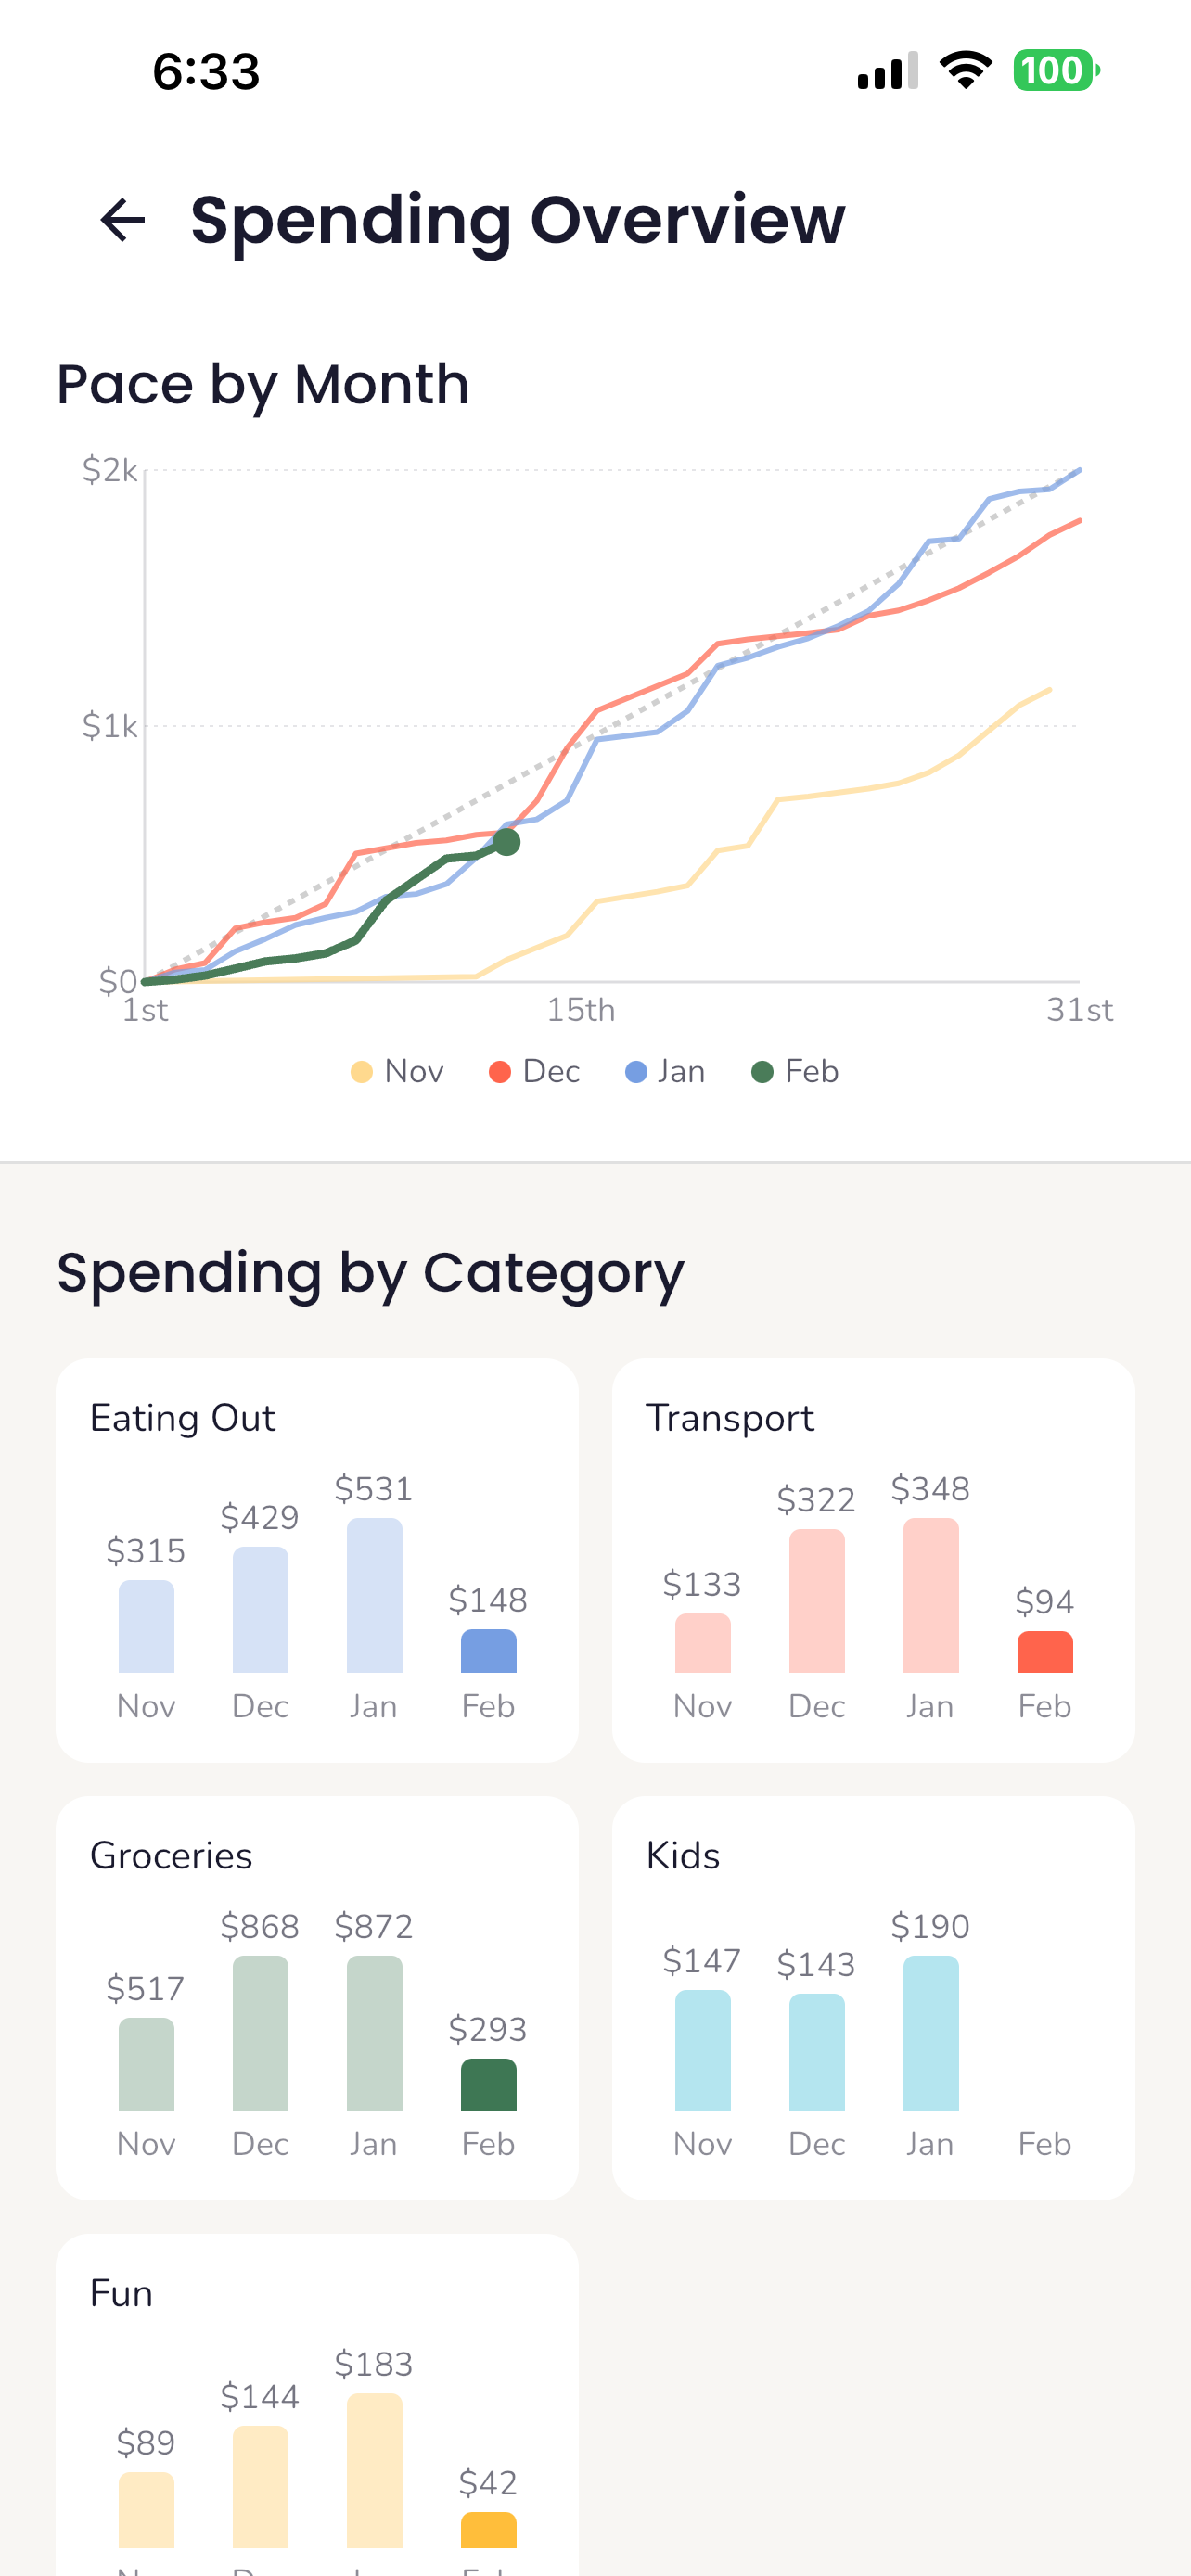
From there, the weekly spend gauge on the home screen takes the variable portion of the budget (everything except housing, utilities, and subscriptions), divides it across weeks remaining in the month, and shows exactly what's safe to spend. It tracks pace within the current week too: if it's Wednesday and you've already spent more than 3/7ths of your weekly budget, the gauge turns red.
Meal Planning and Generation
Before generating meals, users walk through a multi-step preference setup: food likes, allergies, meal goal (quick, budget, high protein, etc.), kids' pickiness level and favorite foods, cooking time, which meal slots they want (breakfast, lunch, dinner, snack, treat), and what to optimize for. All of these get packed into a structured request alongside the remaining grocery budget, family size, kids' ages, and current pantry inventory.
The edge function parses these preferences and builds a focused AI prompt with strict constraints. Allergies are highest priority. Then cooking time, meal goal, and optimization preferences shape the recipe style. If the user has pantry items, those ingredients come back priced at zero. Every recipe is portioned to the exact family size, and prices are estimated conservatively (rounded up so checkout doesn't surprise you).
When the request includes multiple meal types (say three breakfasts and four dinners), the function splits them into parallel calls, one per type, each with its own focused prompt. Results are merged back together. If any type fails, it falls back to hardcoded recipes for that type while the others still come through.
Users can also import recipes three ways. URL import fetches the webpage, strips HTML, and sends the extracted text to AI for structured parsing. Photo import sends the image to GPT-4o's vision API, which can read handwritten recipes, photos of dishes, or menu items. And manual creation lets you build from scratch. All three produce the same structured recipe format with ingredients, steps, nutrition, and estimated pricing.
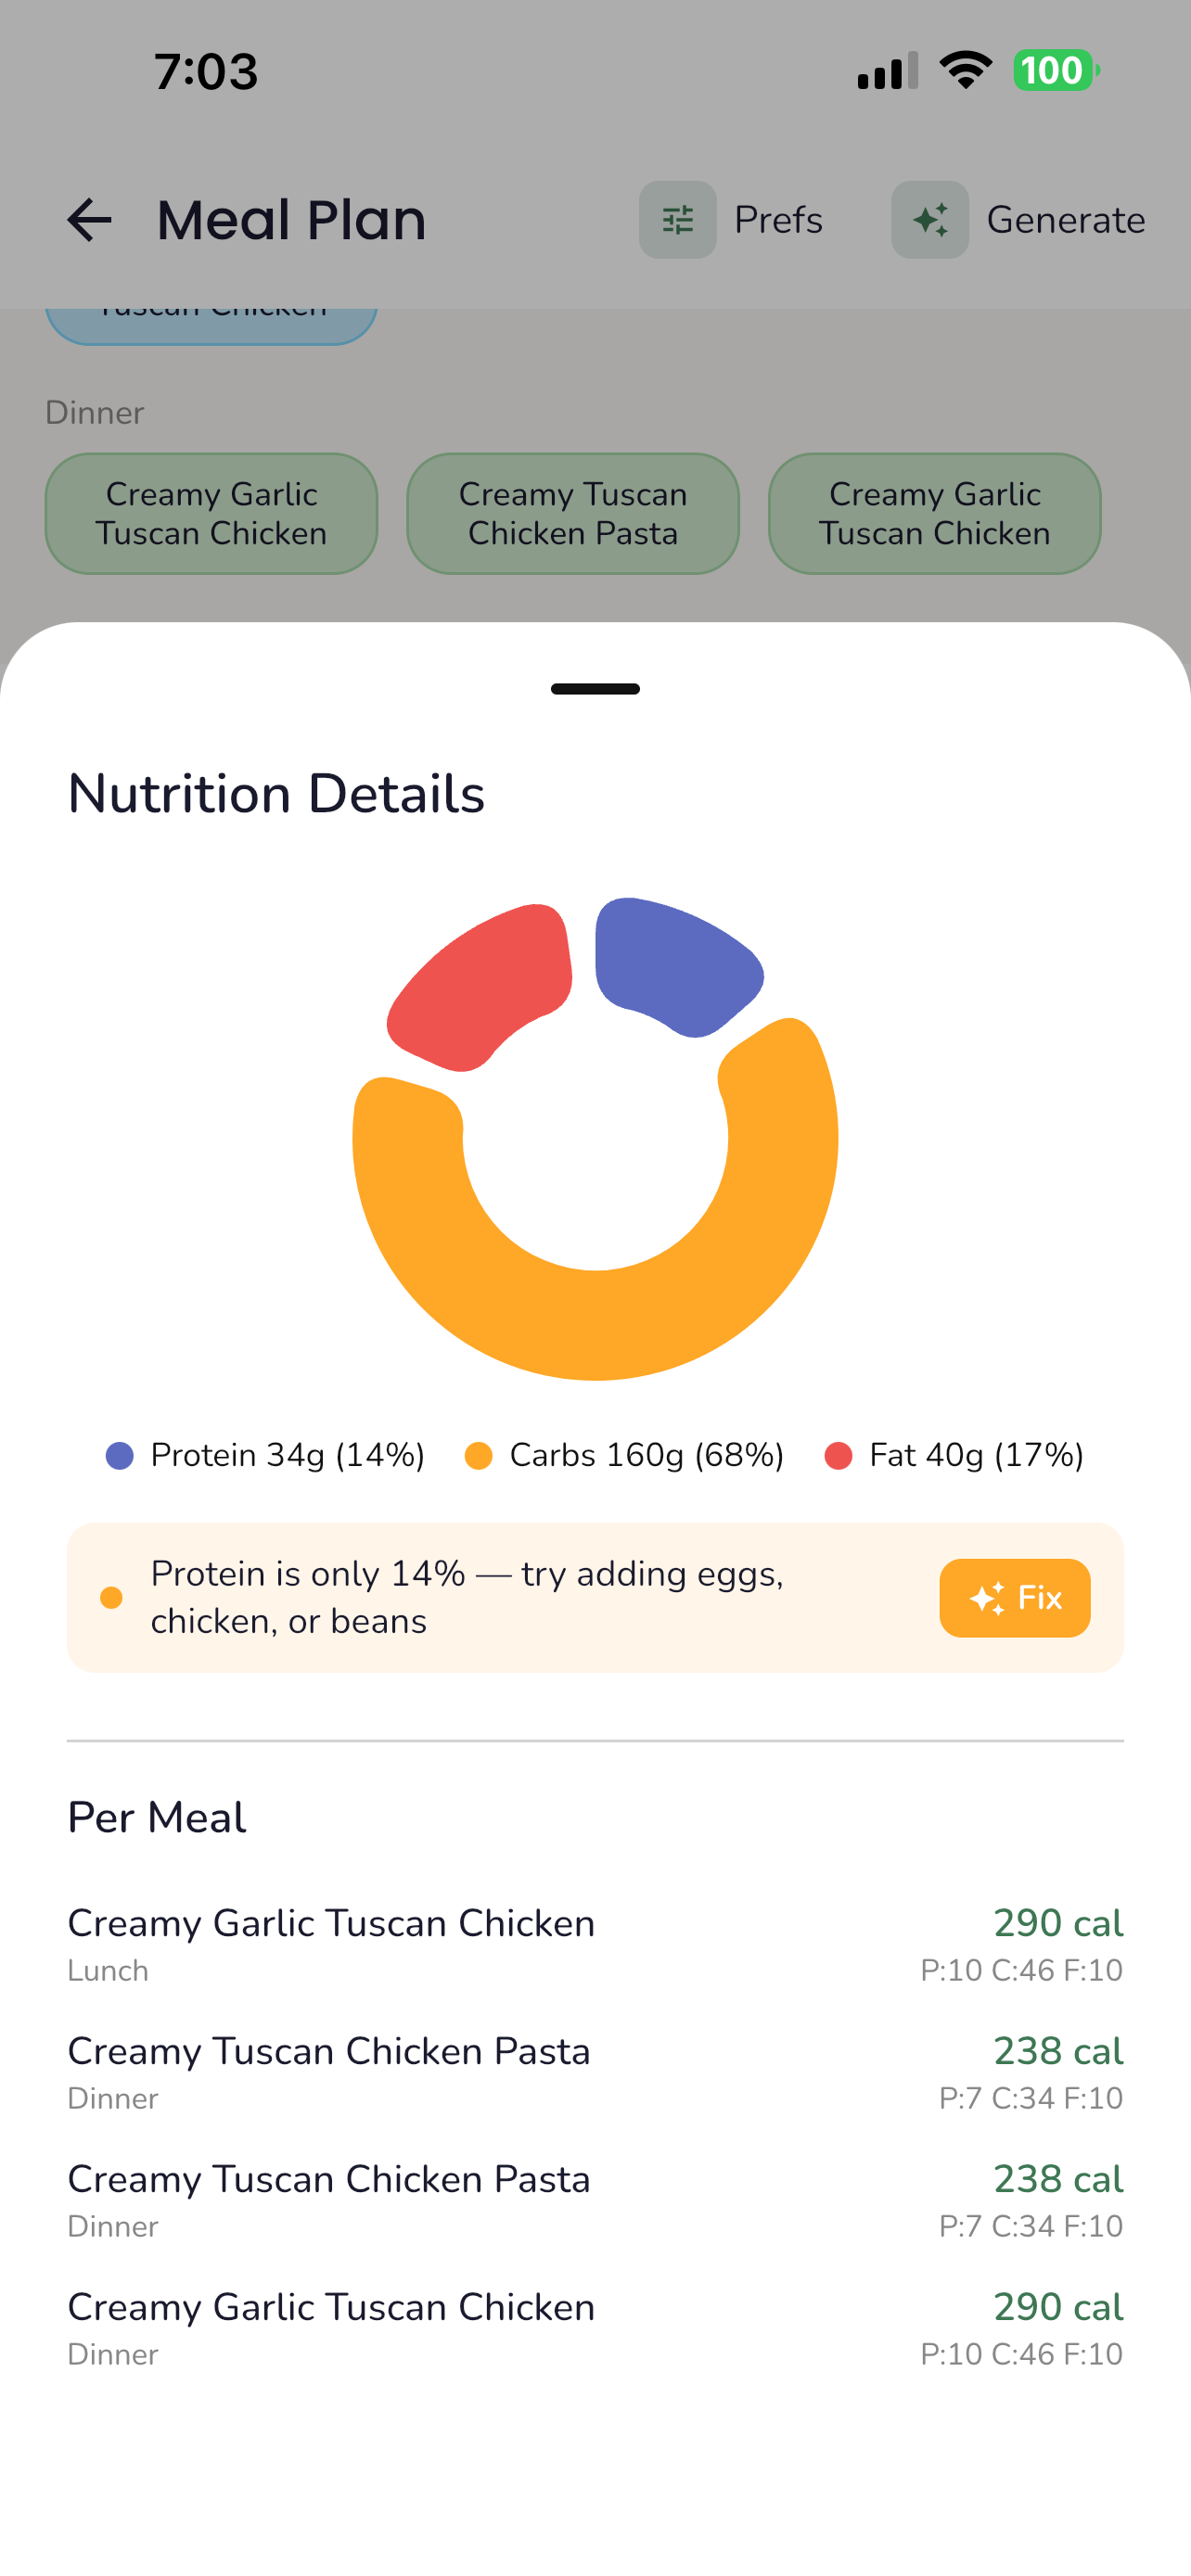
Nutrition is calculated separately using the USDA FoodData Central API. Each ingredient is normalized, looked up against the USDA database, converted to grams using ingredient-specific density tables (a cup of flour is 125g, a cup of milk is 244g, an egg is 50g), and the per-serving macros are calculated from there. The app tracks a confidence score based on how many ingredients were successfully mapped and flags anything it couldn't find.
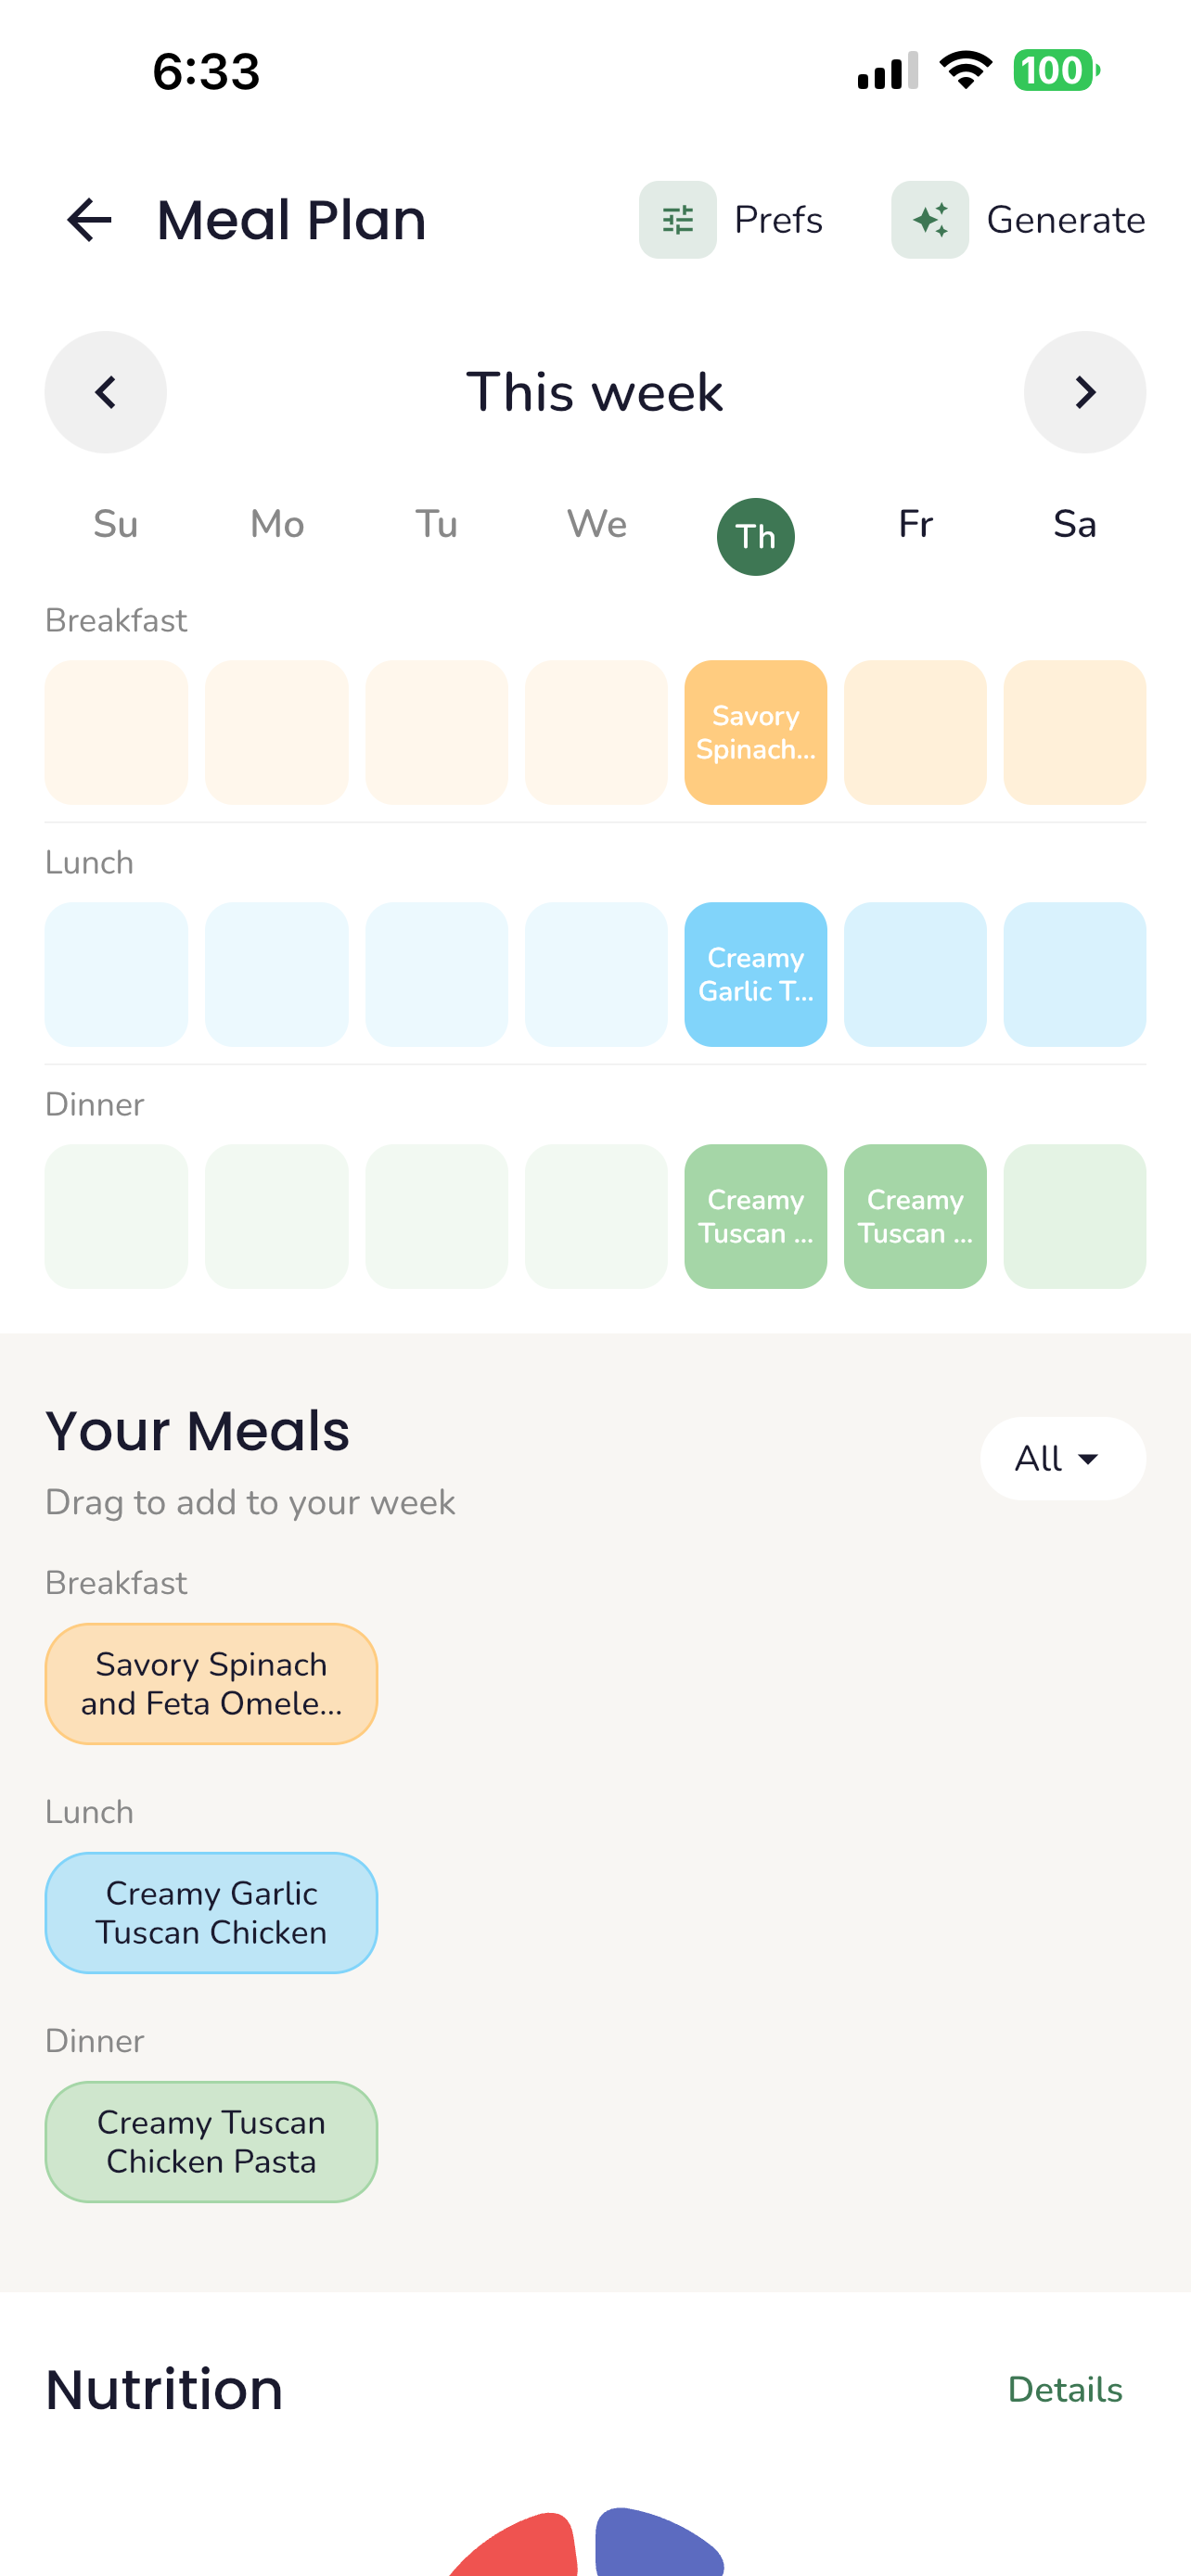
Once meals are generated or imported, users drag and drop them onto a weekly calendar using per-day, per-slot planning. Servings can be overridden per instance without changing the stored recipe, and the shopping list scales ingredient quantities accordingly.
Shopping List
The shopping list is the connective tissue between meal planning, pantry, deals, and store pricing. It pulls from multiple sources: auto-generated from your meal plan, manually added items, and deals saved directly from the deals screen.
When generating from meals, the app extracts every ingredient across the week's planned recipes and combines them intelligently. If Monday's pasta and Wednesday's stir fry both call for garlic, you get one entry with the combined amount. You can also add items manually or save deals directly from the deals screen.
Before the list is finalized, it diffs against your pantry. The system converts between units to check if you already have enough of each item. If a recipe calls for 2 cups of flour and your pantry shows 5 cups, it stays off the list. Only what you're actually missing makes the cut.
From the deals screen, users can save deals directly to their shopping list with a tap. This means your weekly deals and your meal-generated groceries live in the same list, organized by store.
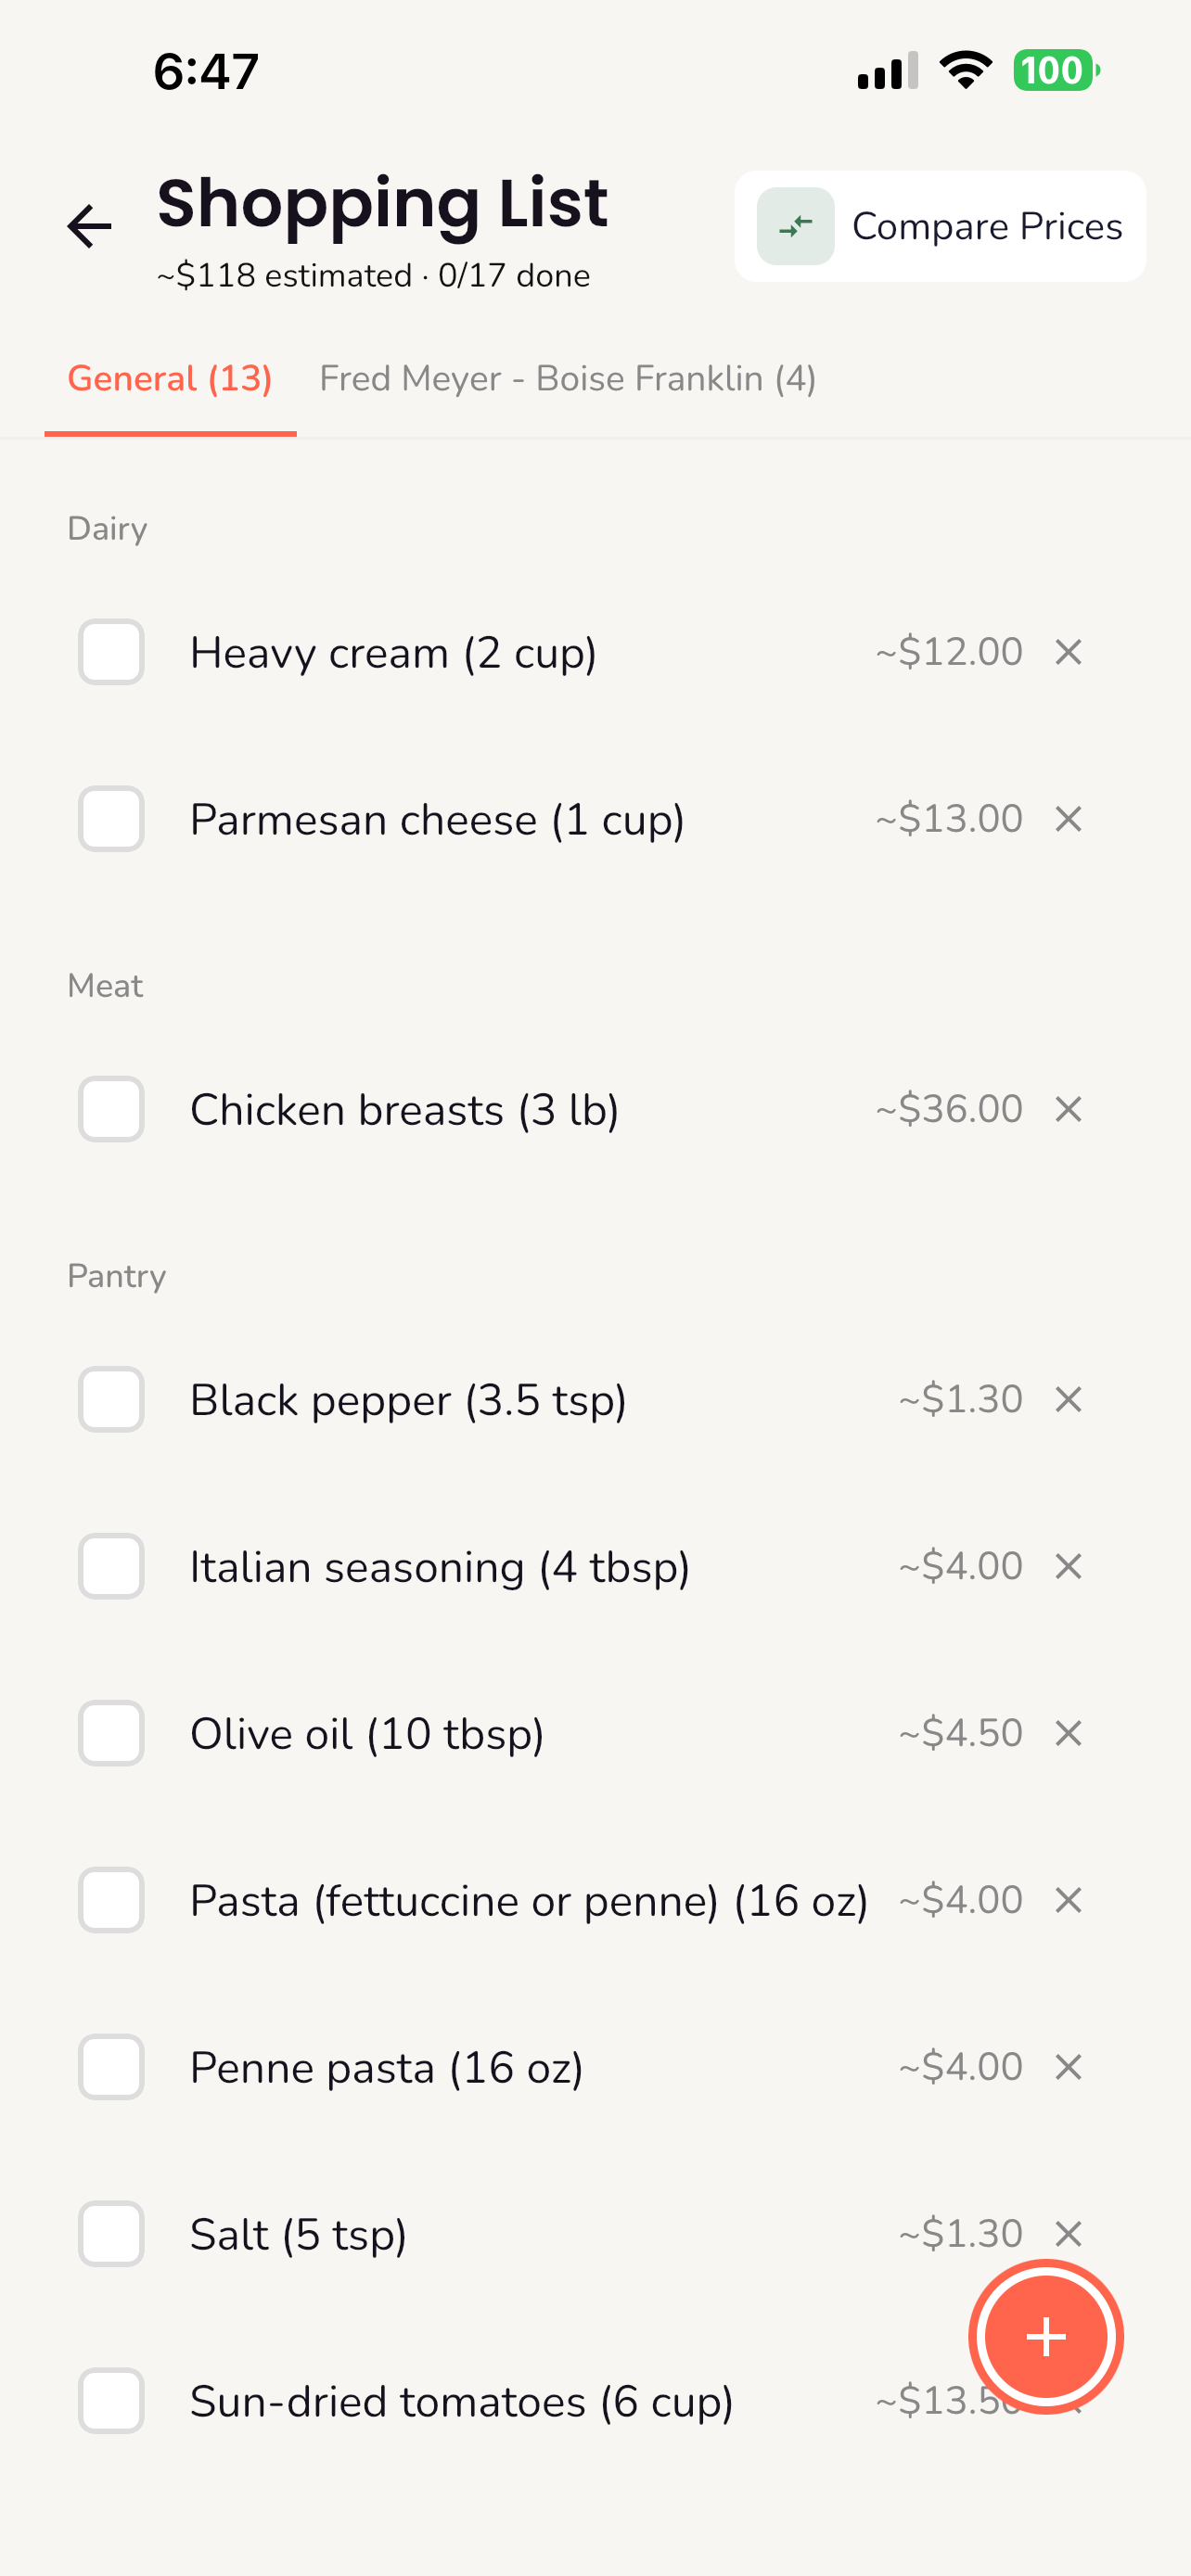
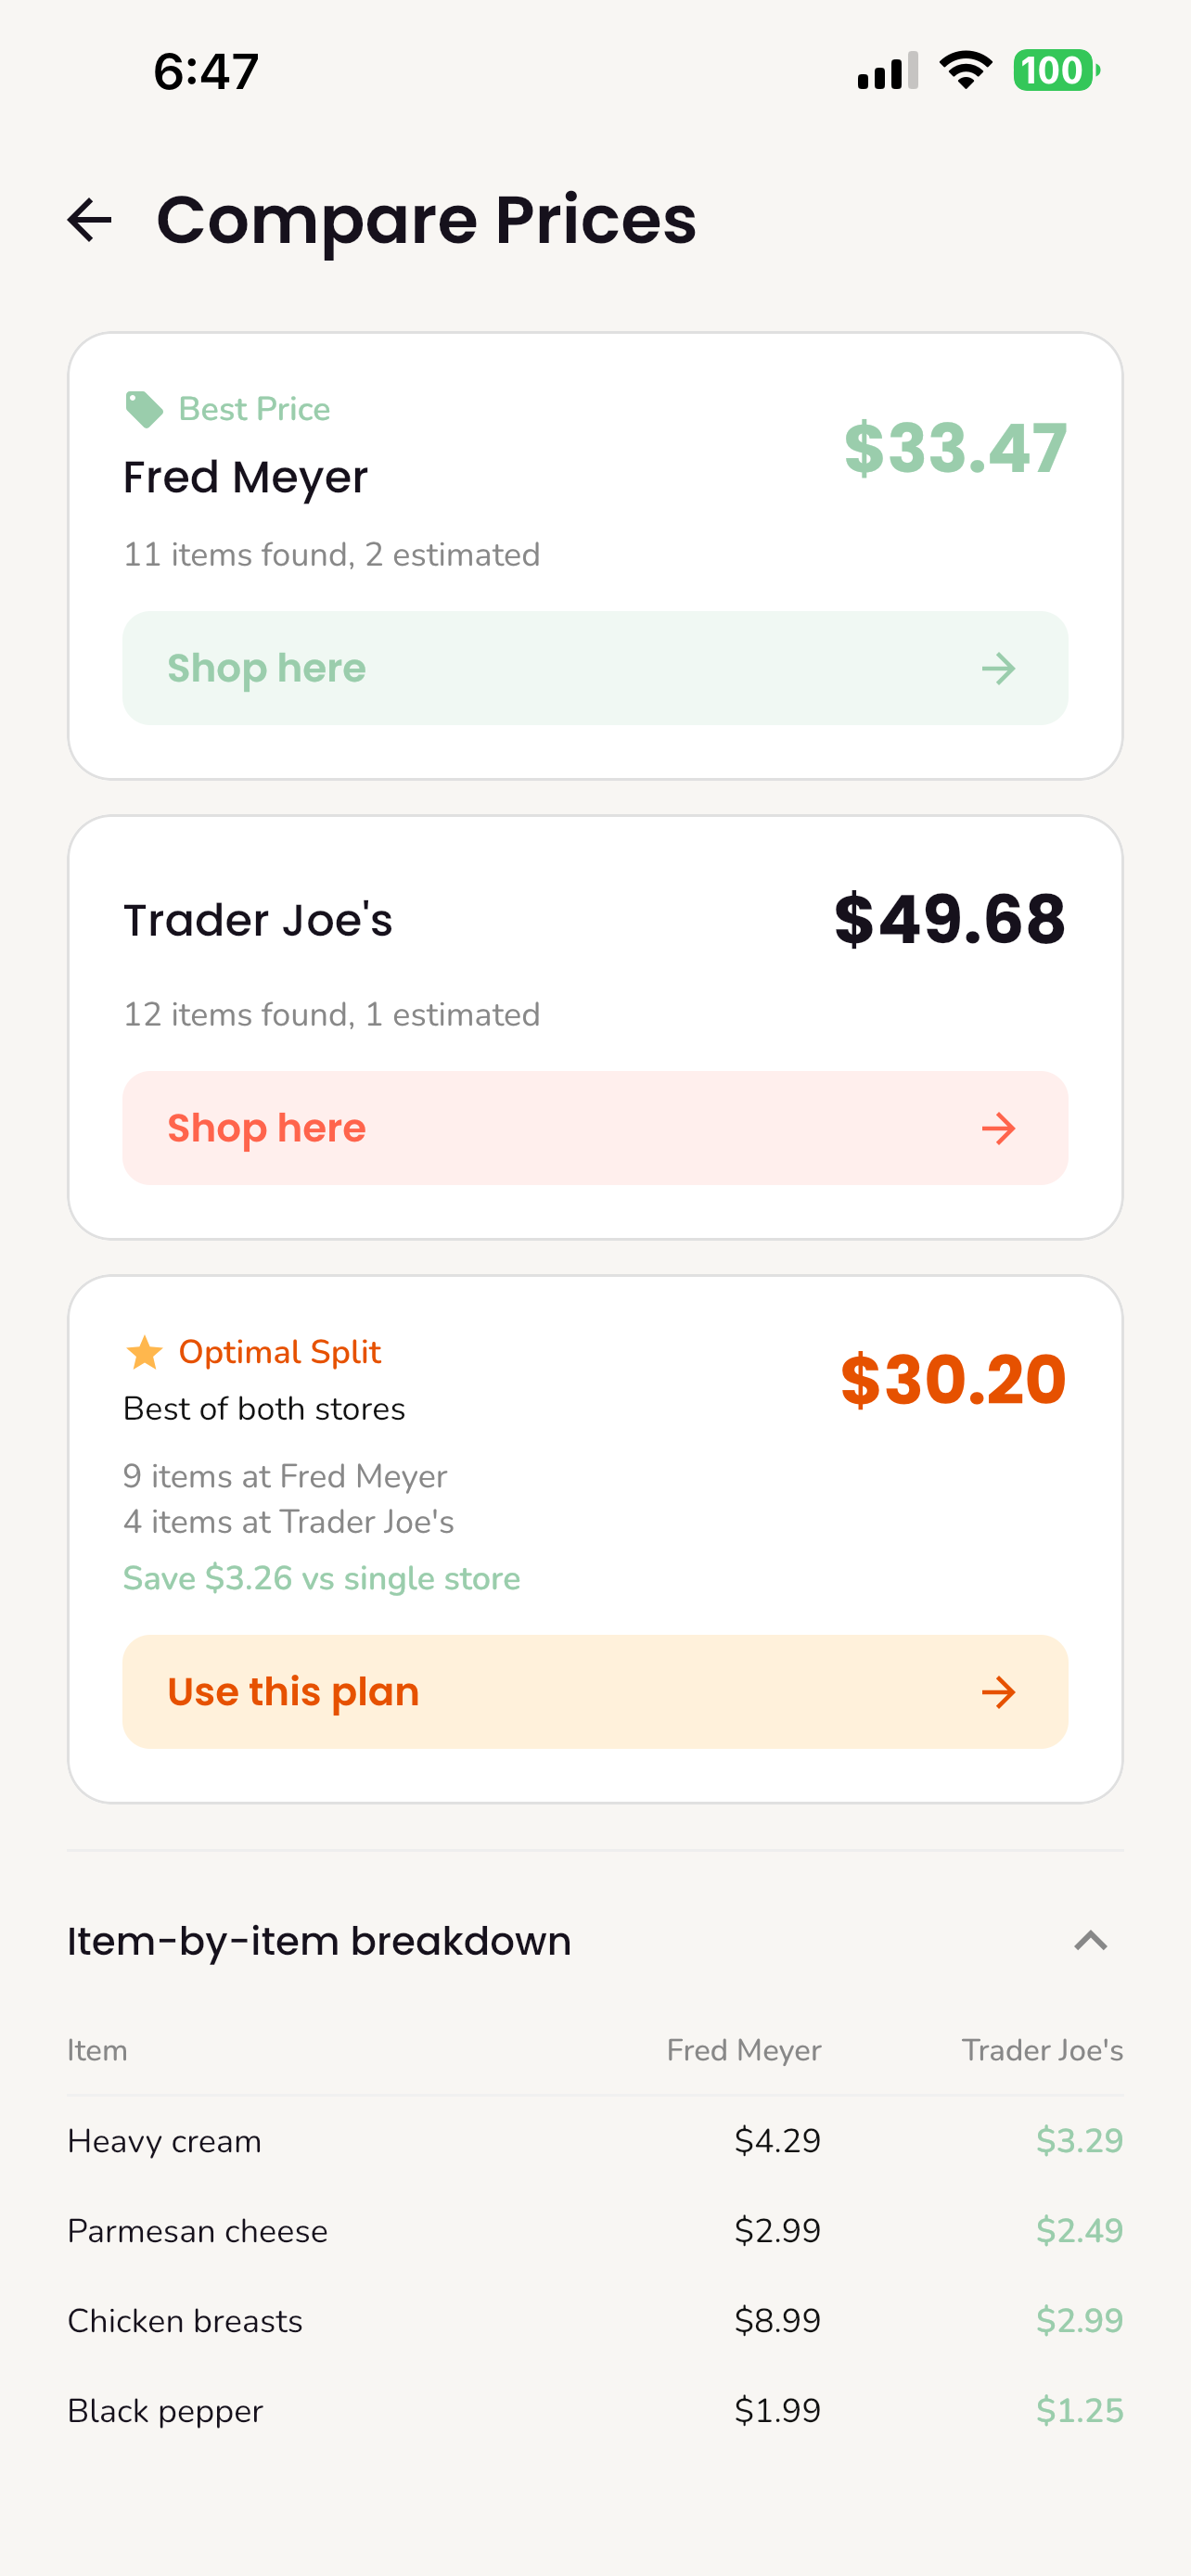
When you're ready to shop, the price comparison feature takes your full list and prices every item across your connected stores. Kroger has a public API that returns location-specific pricing for your nearest store, which works well. Trader Joe's doesn't have a public API, so we're managing a hardcoded product catalog on the backend with national pricing. Finding APIs that give real in-store prices is surprisingly hard. Most grocery chains don't expose pricing publicly, and the ones that do often limit it to loyalty program data. For now, Kroger and our Trader Joe's catalog cover the two most common stores, and we're looking to expand as more retailers open up their data.
The system calculates per-store totals, identifies the best price for each item, and computes an optimal split showing exactly what to buy where to spend the least overall. You can also assign items to specific stores manually if you have a preference.
Pantry
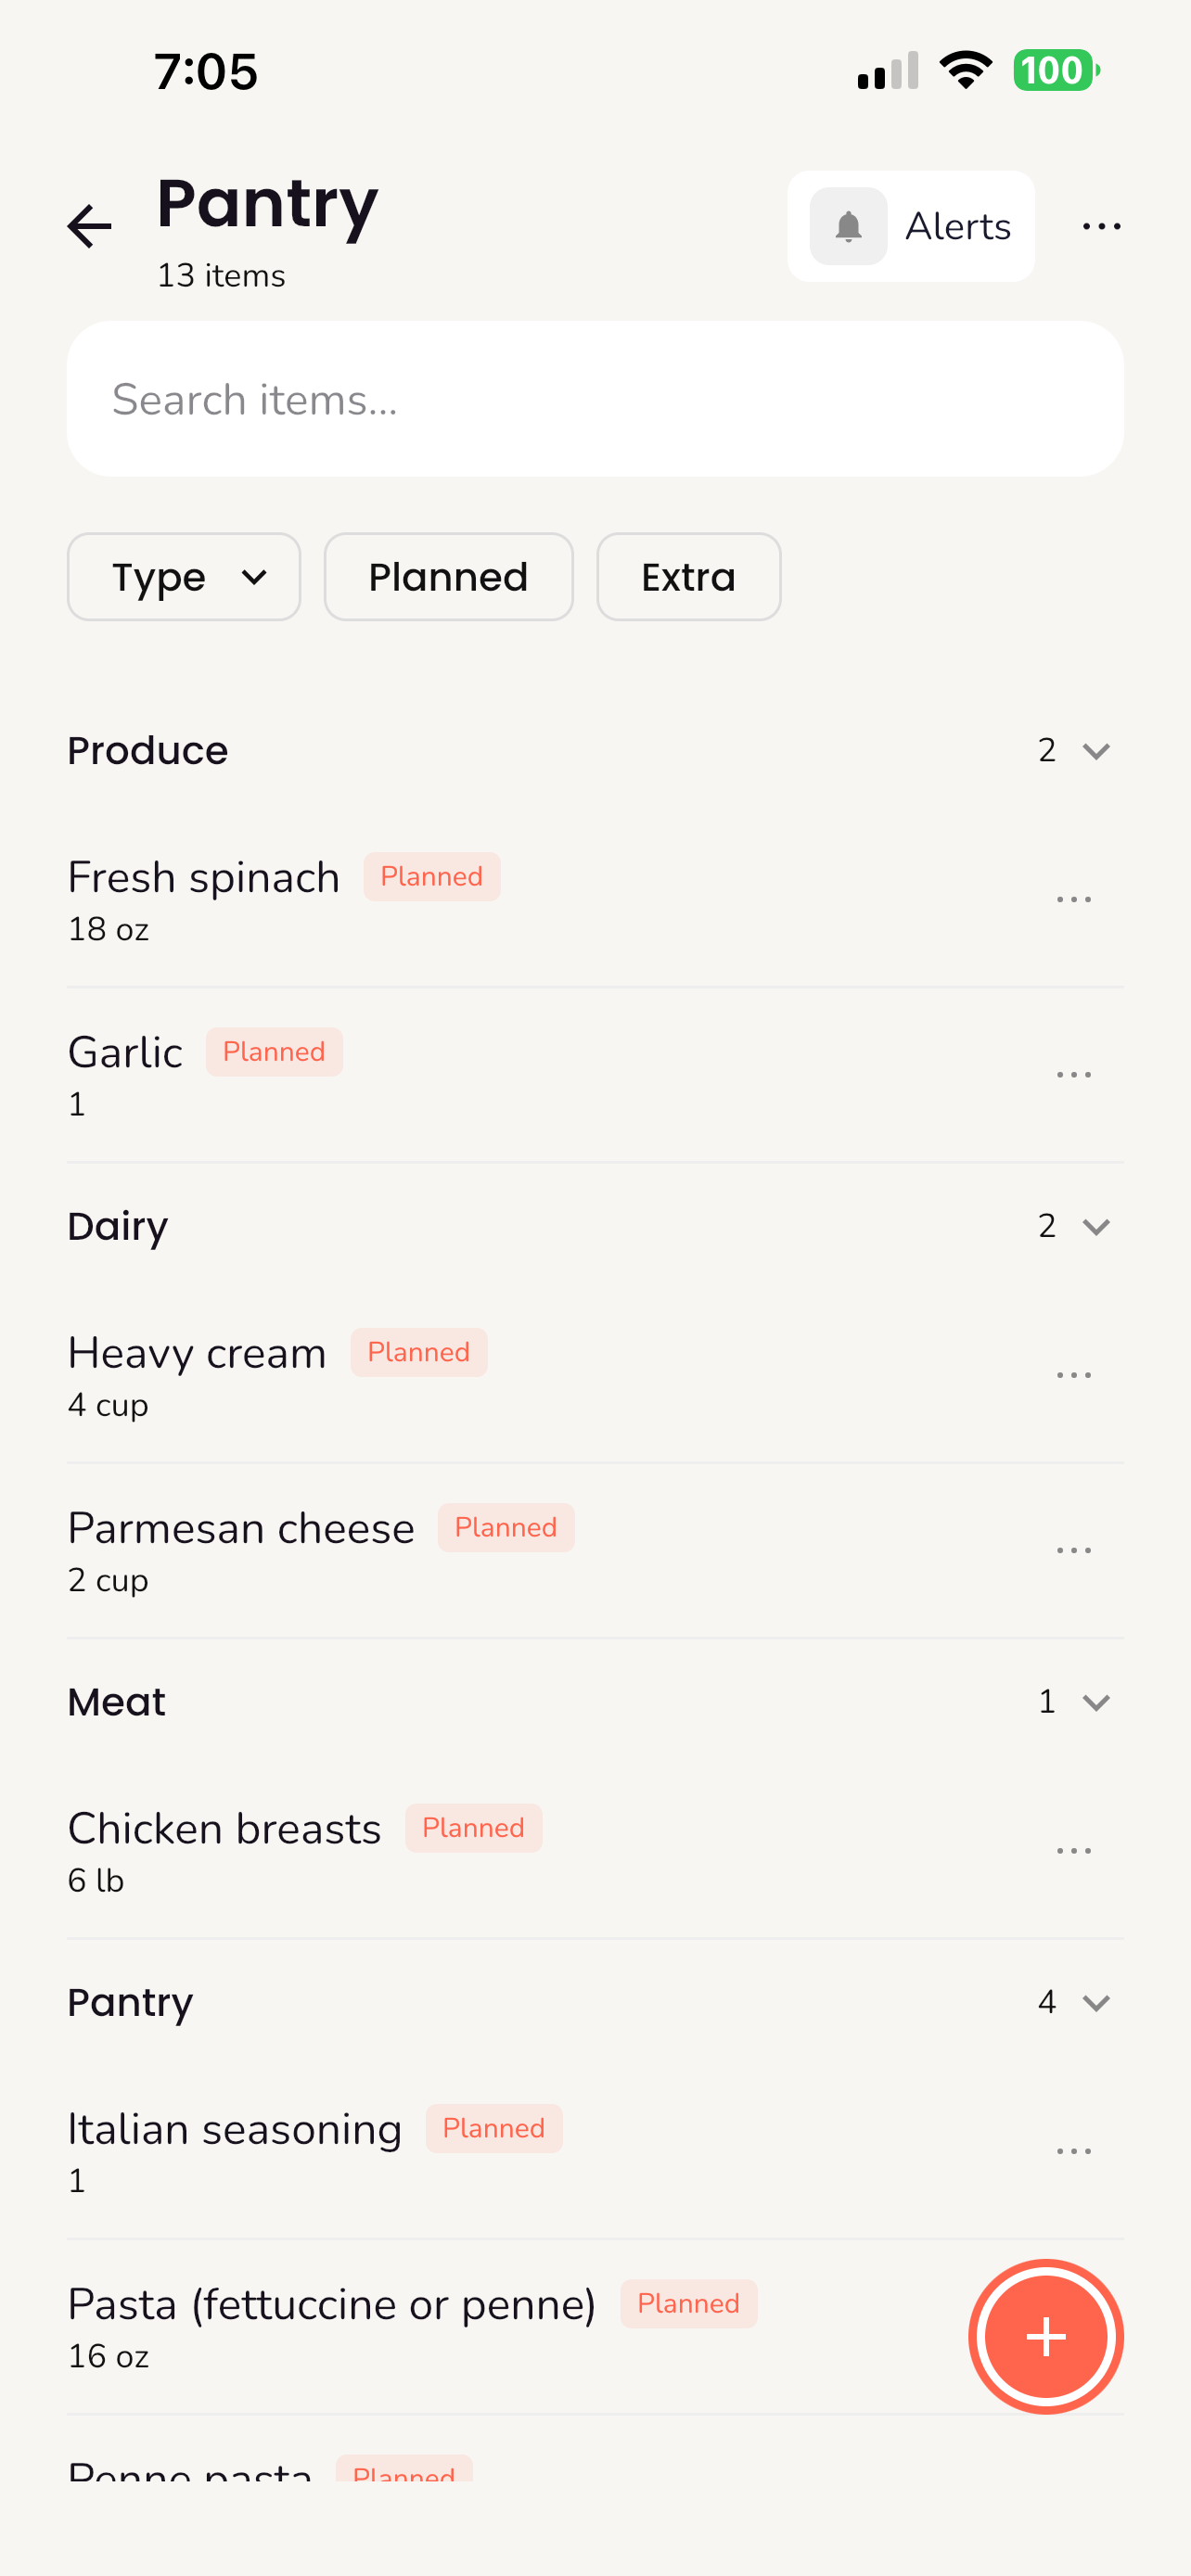
The pantry tracks what you have at home and knows whether each item is reserved for a planned meal or available to use freely. When you're looking at your pantry, you can see at a glance what's spoken for and what's up for grabs. From the unplanned items, you can generate meal suggestions that prioritize using what you already have before buying anything new.
When you mark a recipe as cooked, the pantry automatically removes the ingredients that were used. This keeps inventory in sync without manual tracking, so the next time you generate a shopping list, it knows exactly what you have left.
The technical challenge here is matching. A recipe might call for "2 cups all-purpose flour" while your pantry has "King Arthur Flour, 5 lb bag." Those need to be recognized as the same thing. The system normalizes ingredient names by stripping brand names, descriptors, and qualifiers, then converts between units using ingredient-specific density tables. A pound of flour and cups of flour are comparable because the system knows how dense flour is. Getting this right across hundreds of possible ingredients, unit types, and naming conventions is an ongoing problem, and it's certainly not perfect yet. But even imperfect matching makes the pantry-to-shopping-list flow meaningfully better than starting from scratch every week.
Another unsolved problem is quantity tracking. When you use 2 cups of flour from a 5 lb bag, the pantry needs to know you have roughly 3.5 lbs left. Right now, marking a recipe as cooked removes the ingredient entirely. Partial deduction and knowing when to suggest restocking is something we haven't cracked yet. It requires reliable unit conversion in both directions, tracking fractional quantities across multiple uses, and deciding when "almost out" means "add to shopping list." It's on the roadmap.
Deals
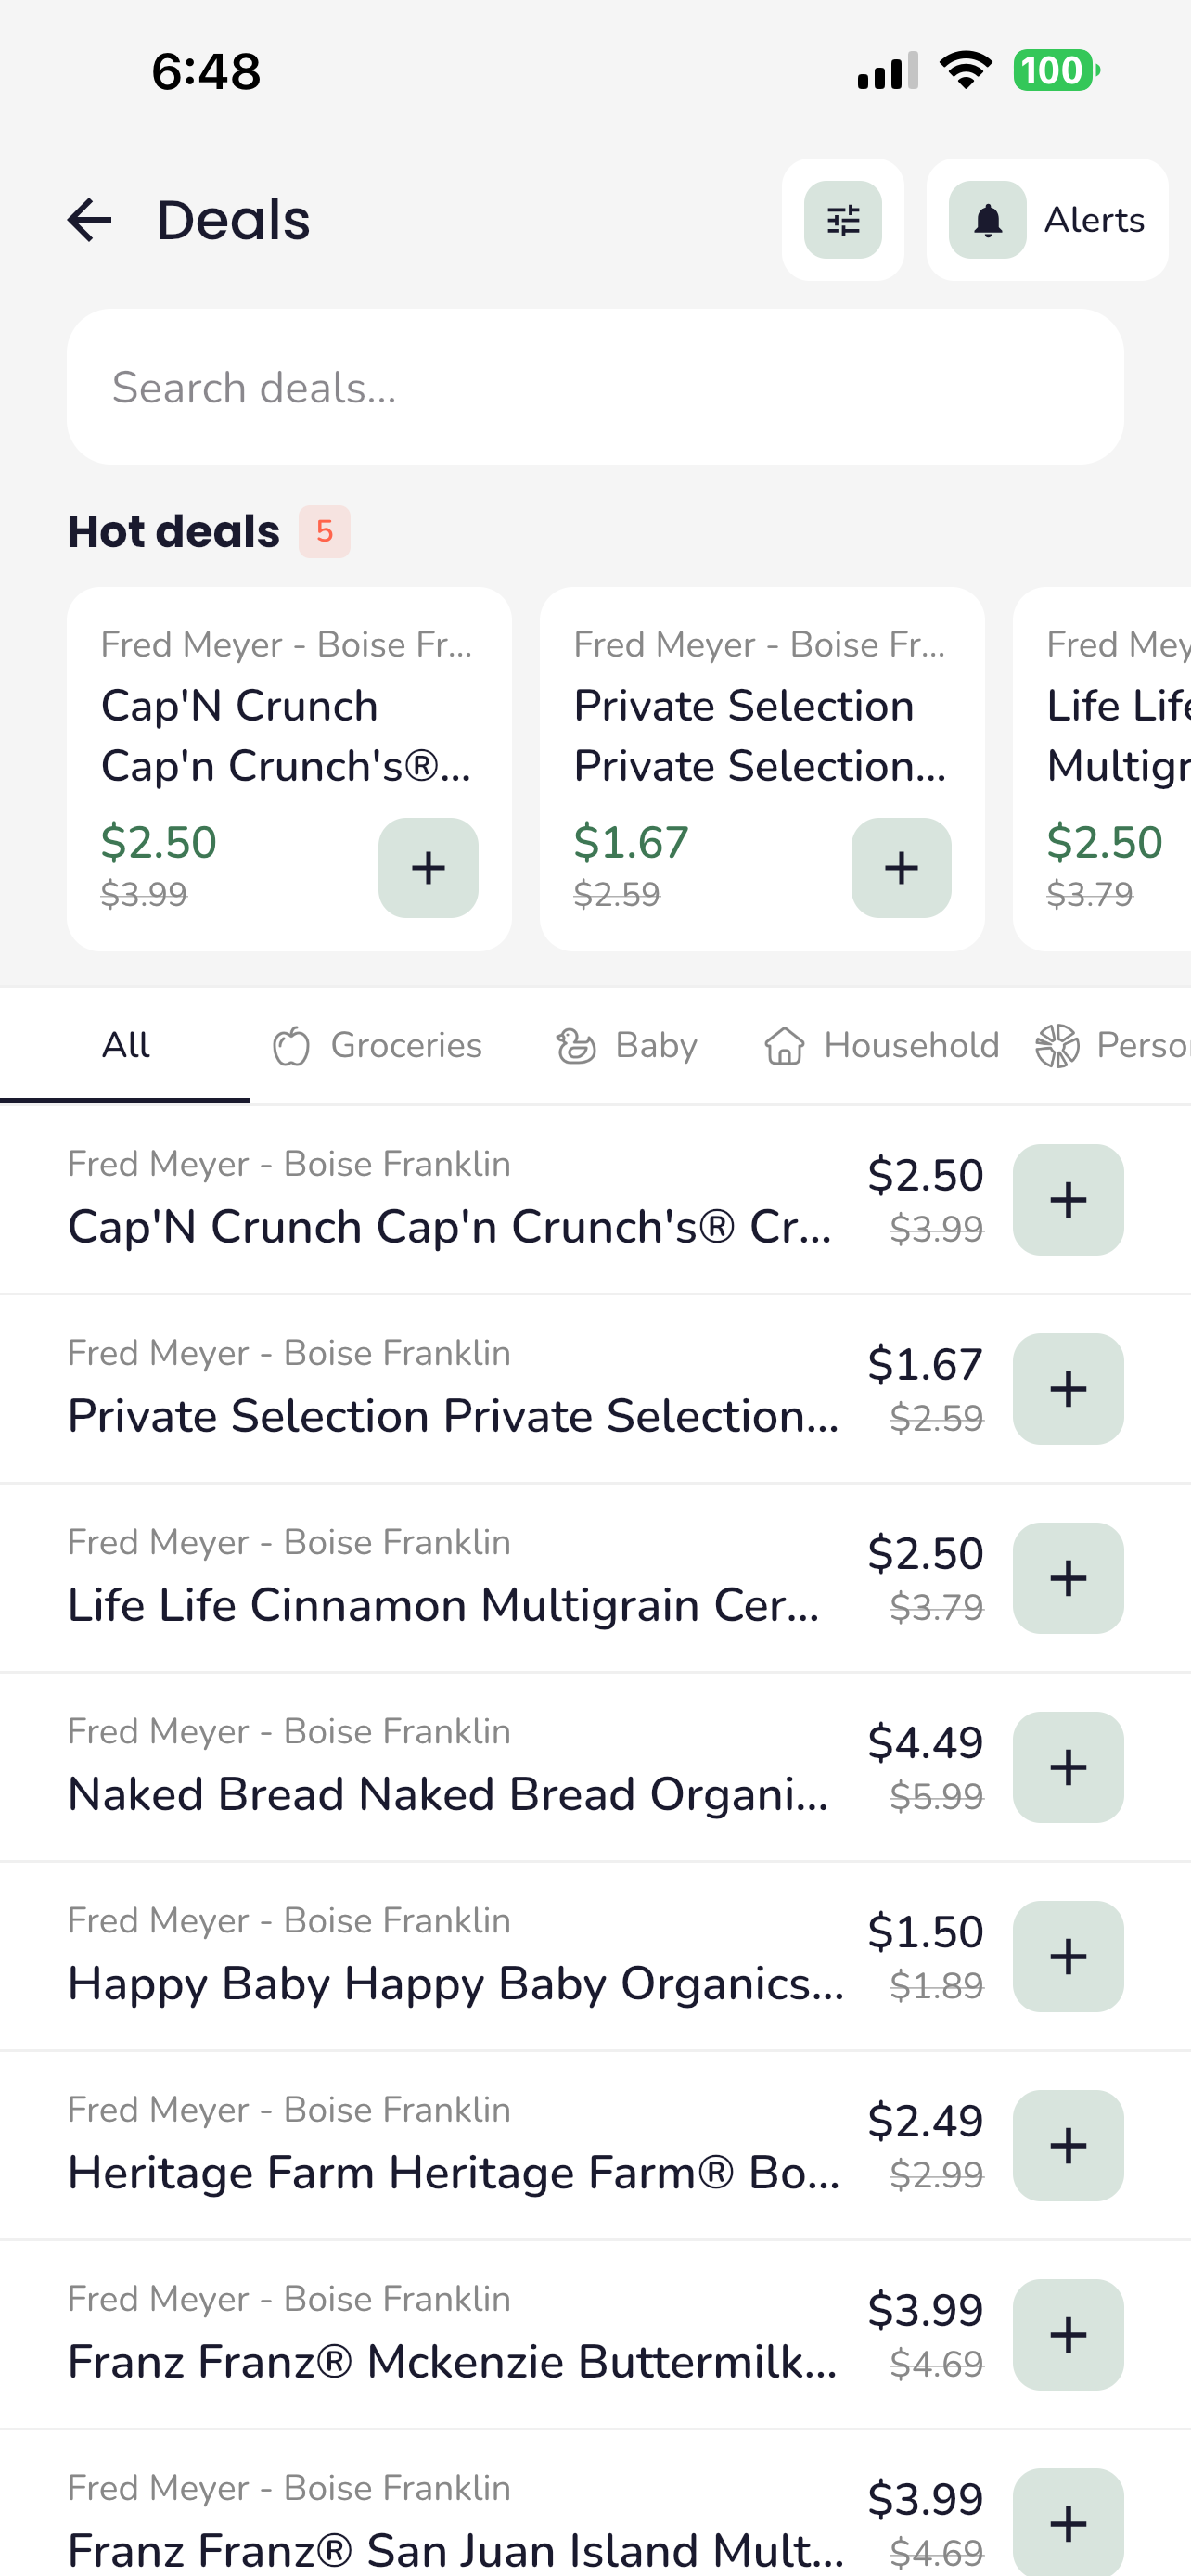
Deals are sourced from the Kroger API using location-specific product searches. Each deal category (groceries, baby and kids, household essentials, etc.) maps to a curated set of search terms. The API returns products with regular and promotional prices, and only products with a real discount make the cut. The app calculates the savings percentage, and anything at 20% off or more gets flagged as a hot deal. Above 40% is marked as amazing. Deals are sorted by savings percentage by default, with options to sort by price or recency. The top 3 surface on the home screen, with the top 5 hot deals featured on the full deals screen. Users can add deals directly to their shopping list.
Deal Alerts
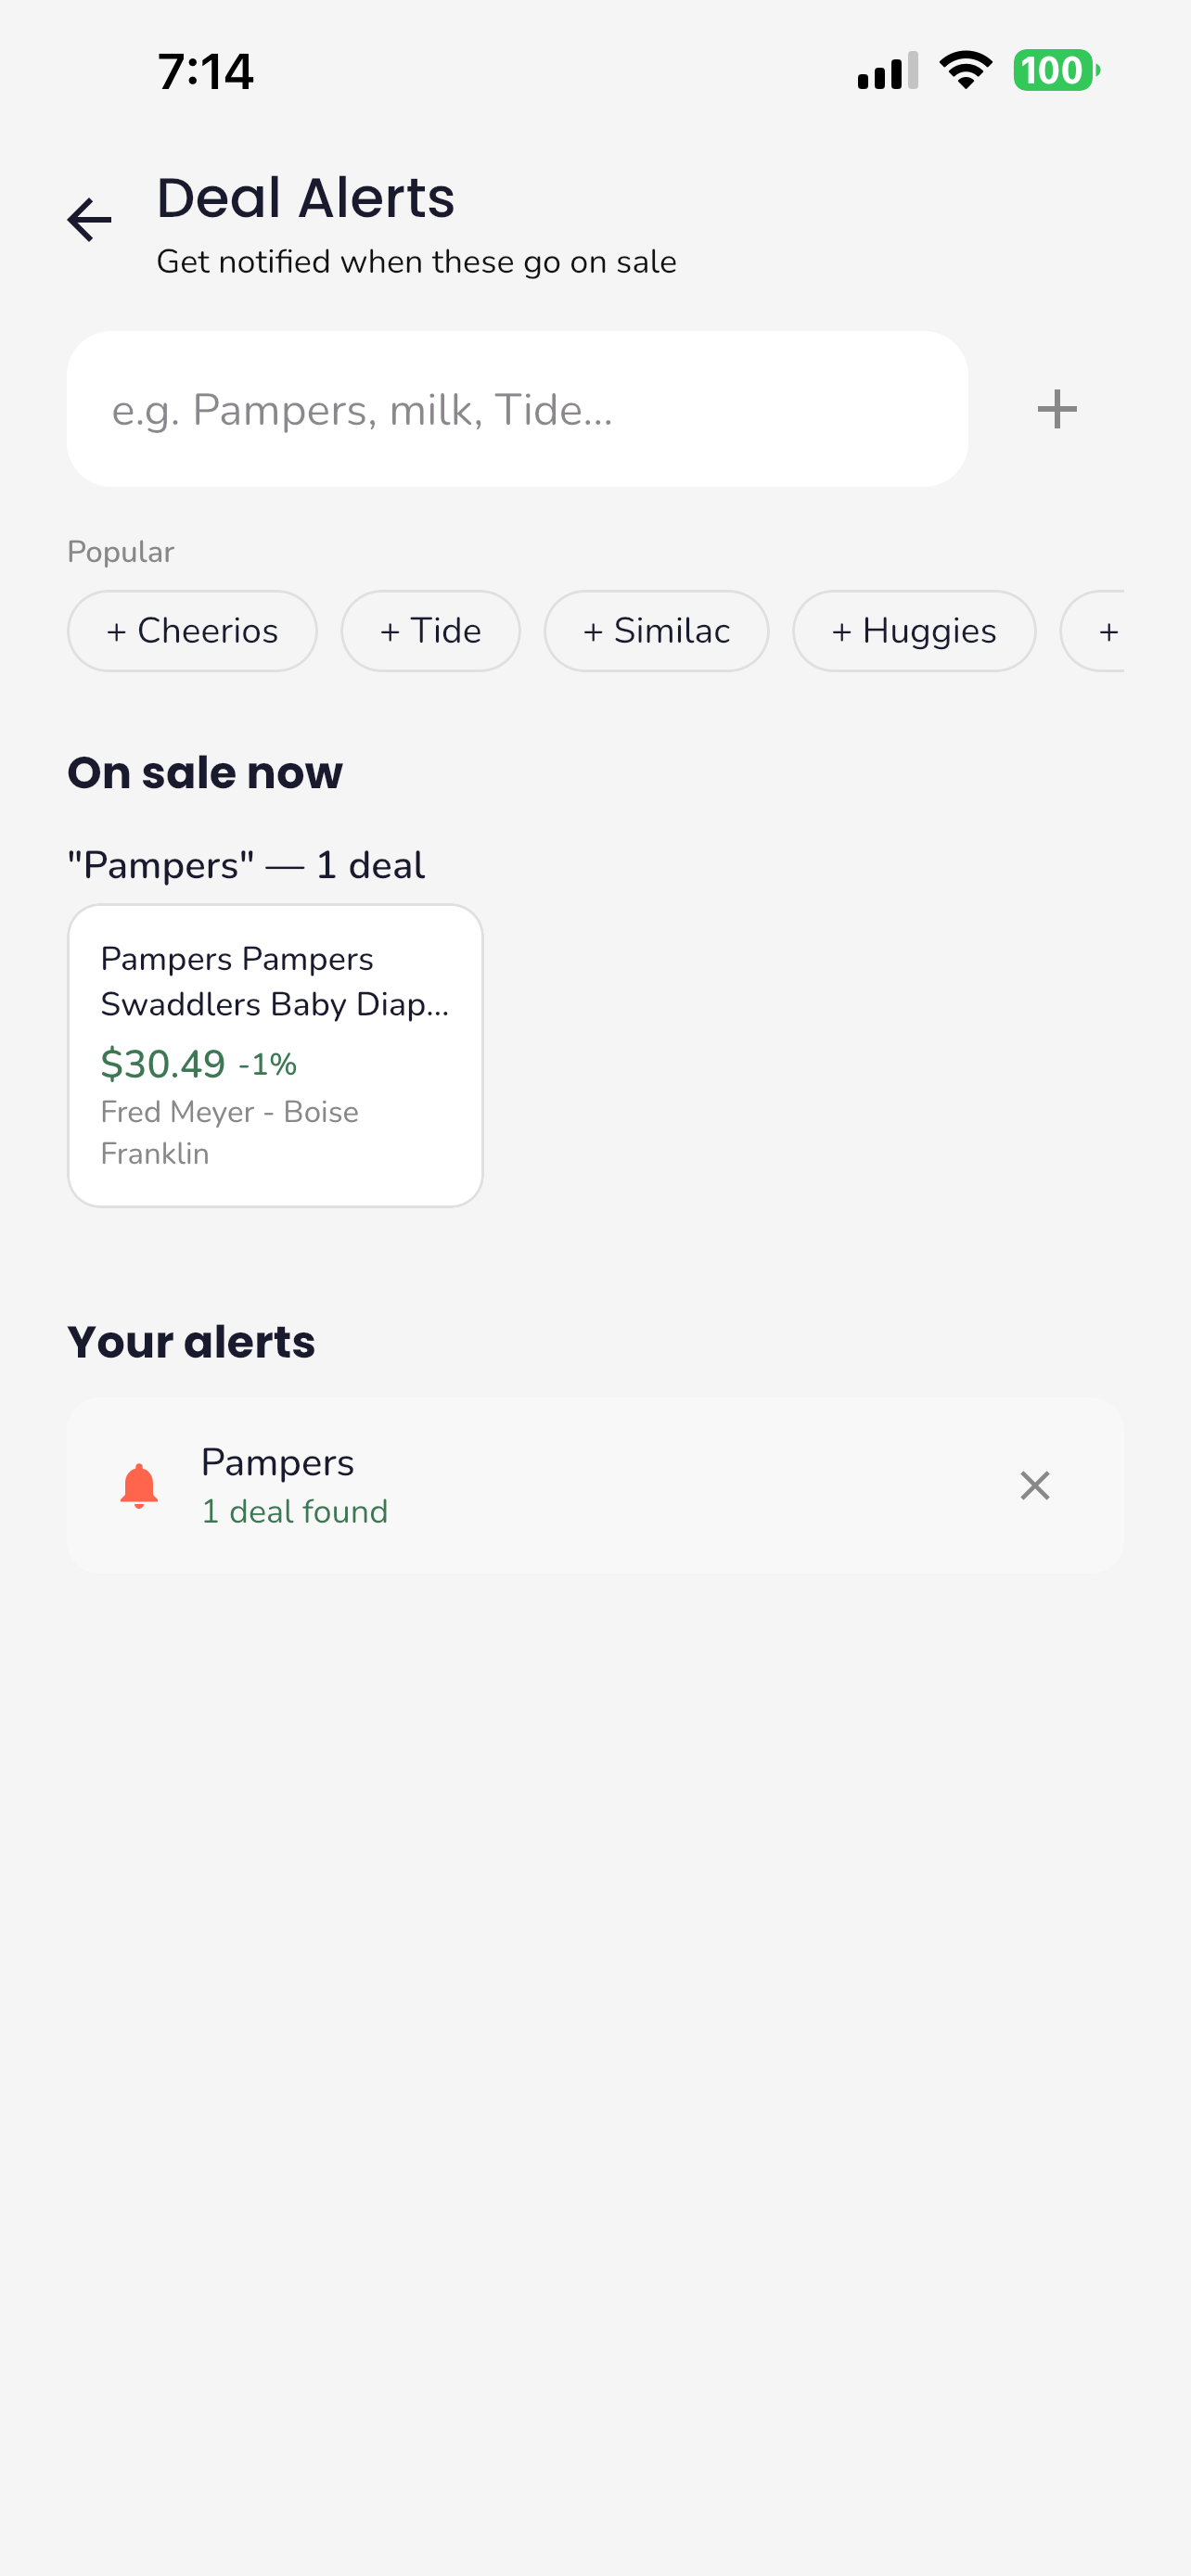
Users set the categories they care about and optional keyword alerts. Deals matching their preferences show up automatically and trigger notifications when new matches are found.
A daily cron runs at noon EST, fetching fresh deals for zip codes with active users. Ideally this would run per zip code on a tighter interval, but that doesn't scale. Every zip code means a separate set of API calls to Kroger for location-specific pricing, and running that across thousands of zip codes every few hours adds up fast. Right now, only zips with active users get queried, which keeps the volume reasonable. Scaling this to a national user base will require real infrastructure planning around caching, batching, and figuring out how aggressively we can hit retailer APIs without getting rate-limited.
Savings and Wealth
Trellis supports six goal types: emergency fund, vacation, college fund, retirement, big purchase, and custom. Each has its own treatment. Retirement is the most involved: you enter your current age and retirement age, and the app computes the timeline and leaves the target amount open-ended since it depends on planning that happens after creation.
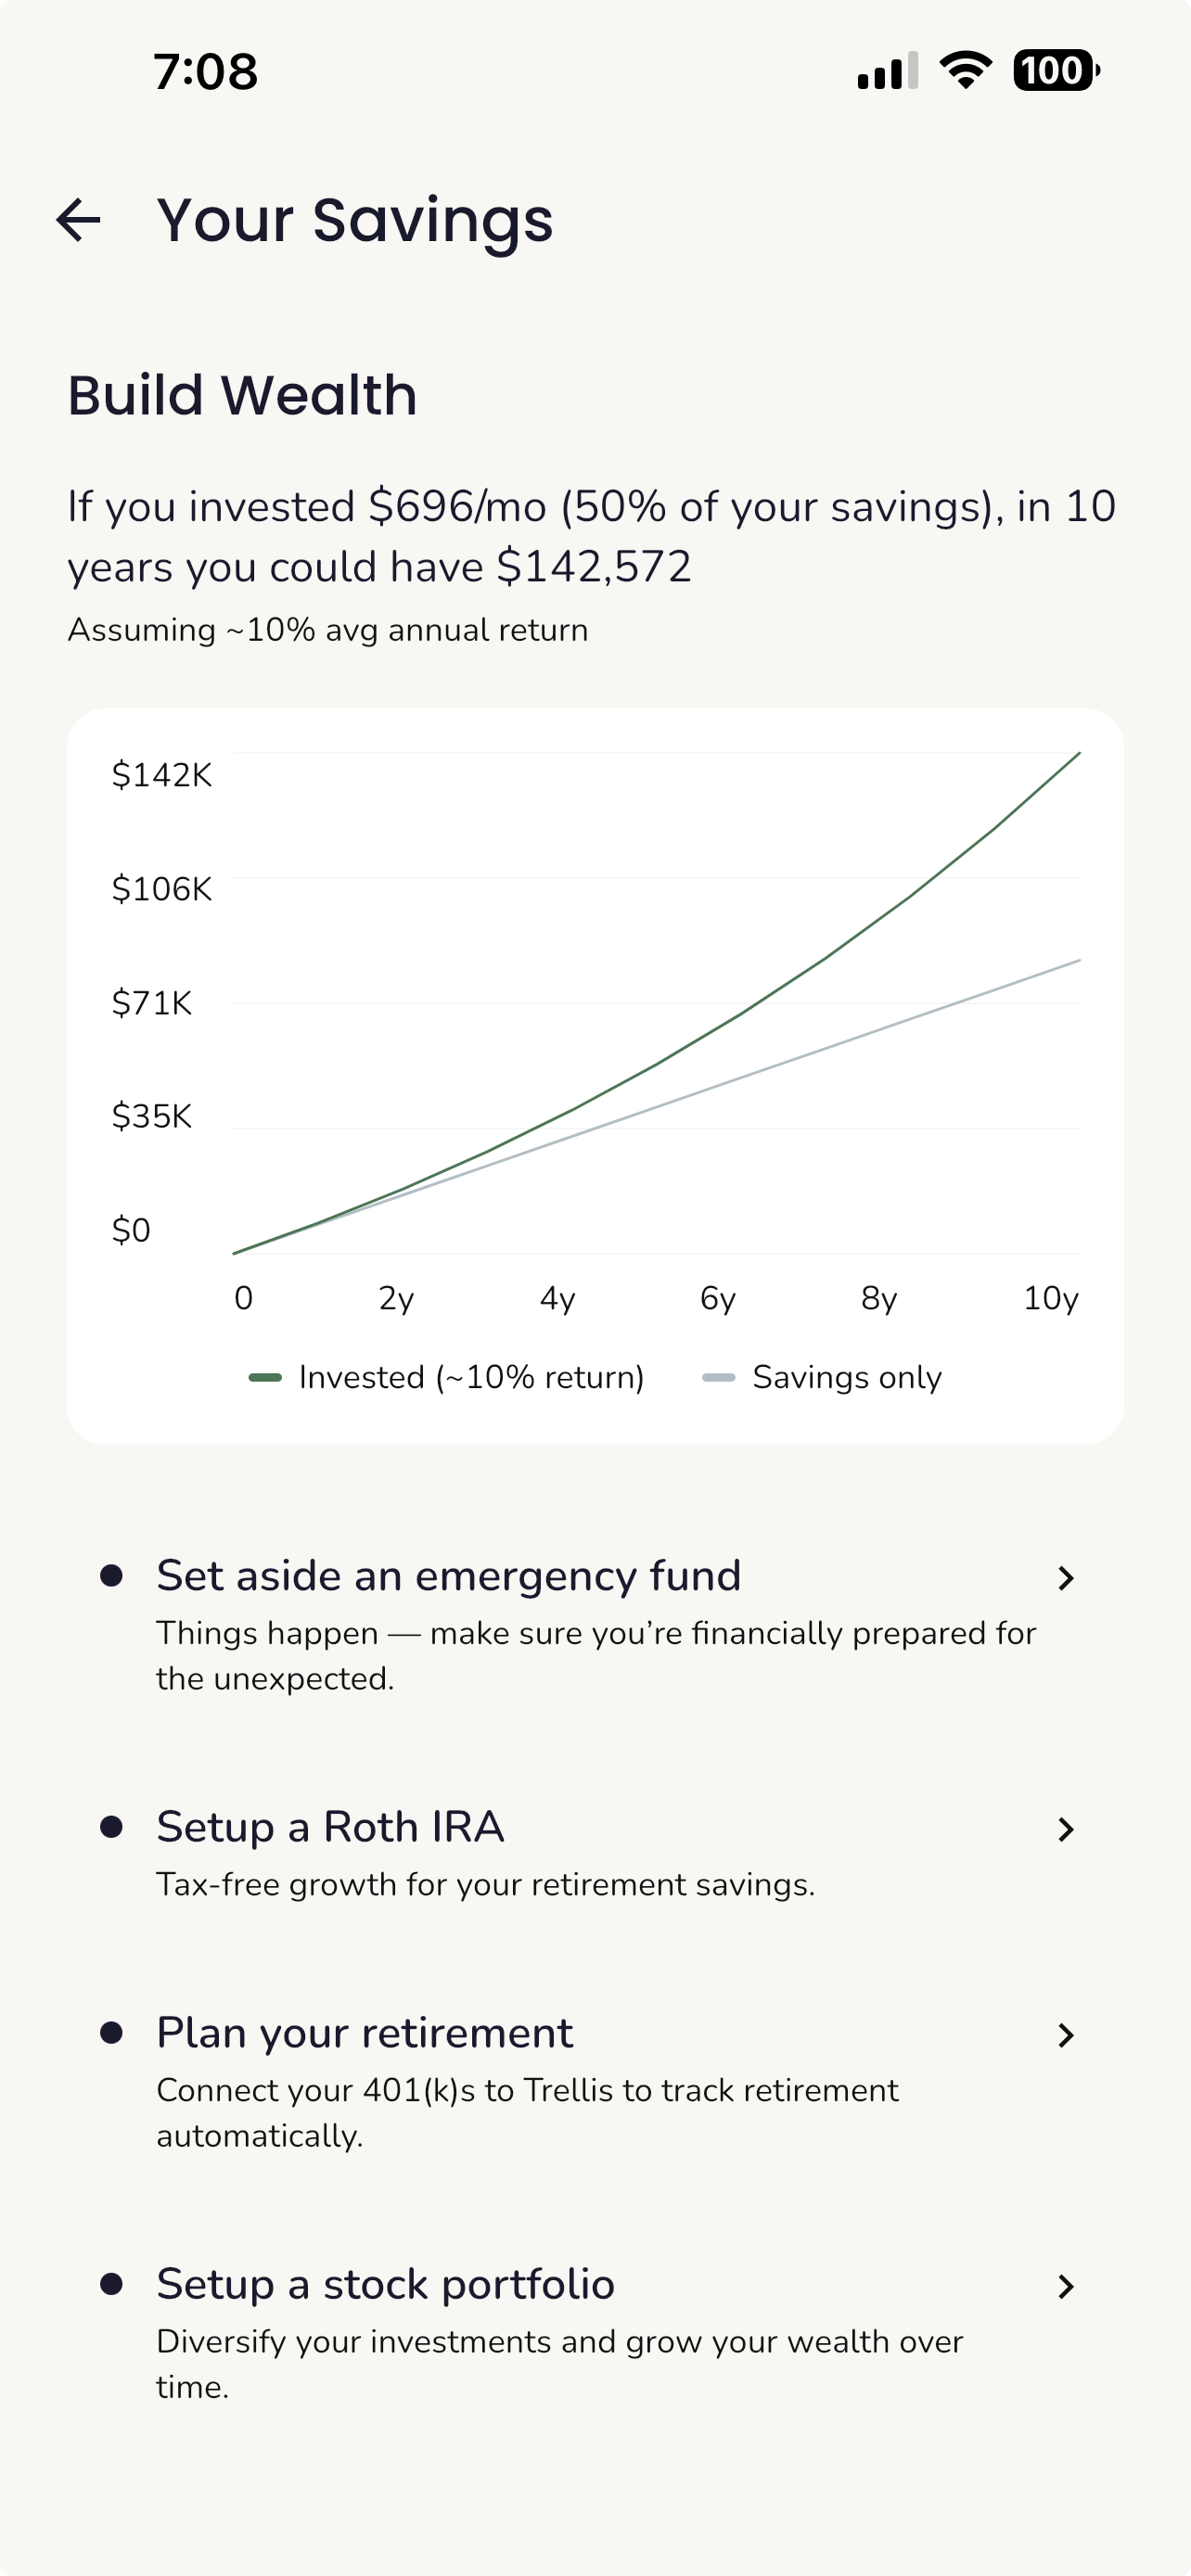
The savings overview screen splits into two paths based on the user's projected monthly savings. Users saving more than $500/month see wealth-building content: Roth IRAs, retirement planning with employer match guidance, stock portfolio basics with index fund recommendations, and a 10-year compound growth projection comparing savings-only vs invested returns. Users with less room see a different experience focused on building a safety net: emergency fund milestones ($500 for a car repair, $1,000 for a medical bill, up to two months of expenses), tips for finding small savings, and a check for state assistance programs like SNAP, WIC, Medicaid, and utility assistance based on household size and income relative to the federal poverty line.
Monthly wealth advice is generated per user and cached for the month. The system gathers the user's income, spending history, existing goals, and location, then generates personalized recommendations. Low-savings users get emergency fund guidance with concrete steps. Higher-savings users get advice on compound interest, tax-advantaged accounts, and balancing goal contributions with retirement savings.
The financial agent takes this further with an interactive chat. Each conversation gets its own thread, and the agent has access to the user's last 60 days of transactions, category spending breakdowns, merchant details, and their latest spending report. It can reference real numbers from their account. Ask "where am I overspending?" and it'll pull your actual merchant data and give a specific answer. The tone is warm and concise: 2-4 sentences, one actionable takeaway, no essays.
Every wealth topic (emergency funds, Roth IRAs, retirement, investing, state resources) has a detailed info sheet with an "Ask questions" button that drops you into the agent with that topic as context, so the conversation starts relevant.
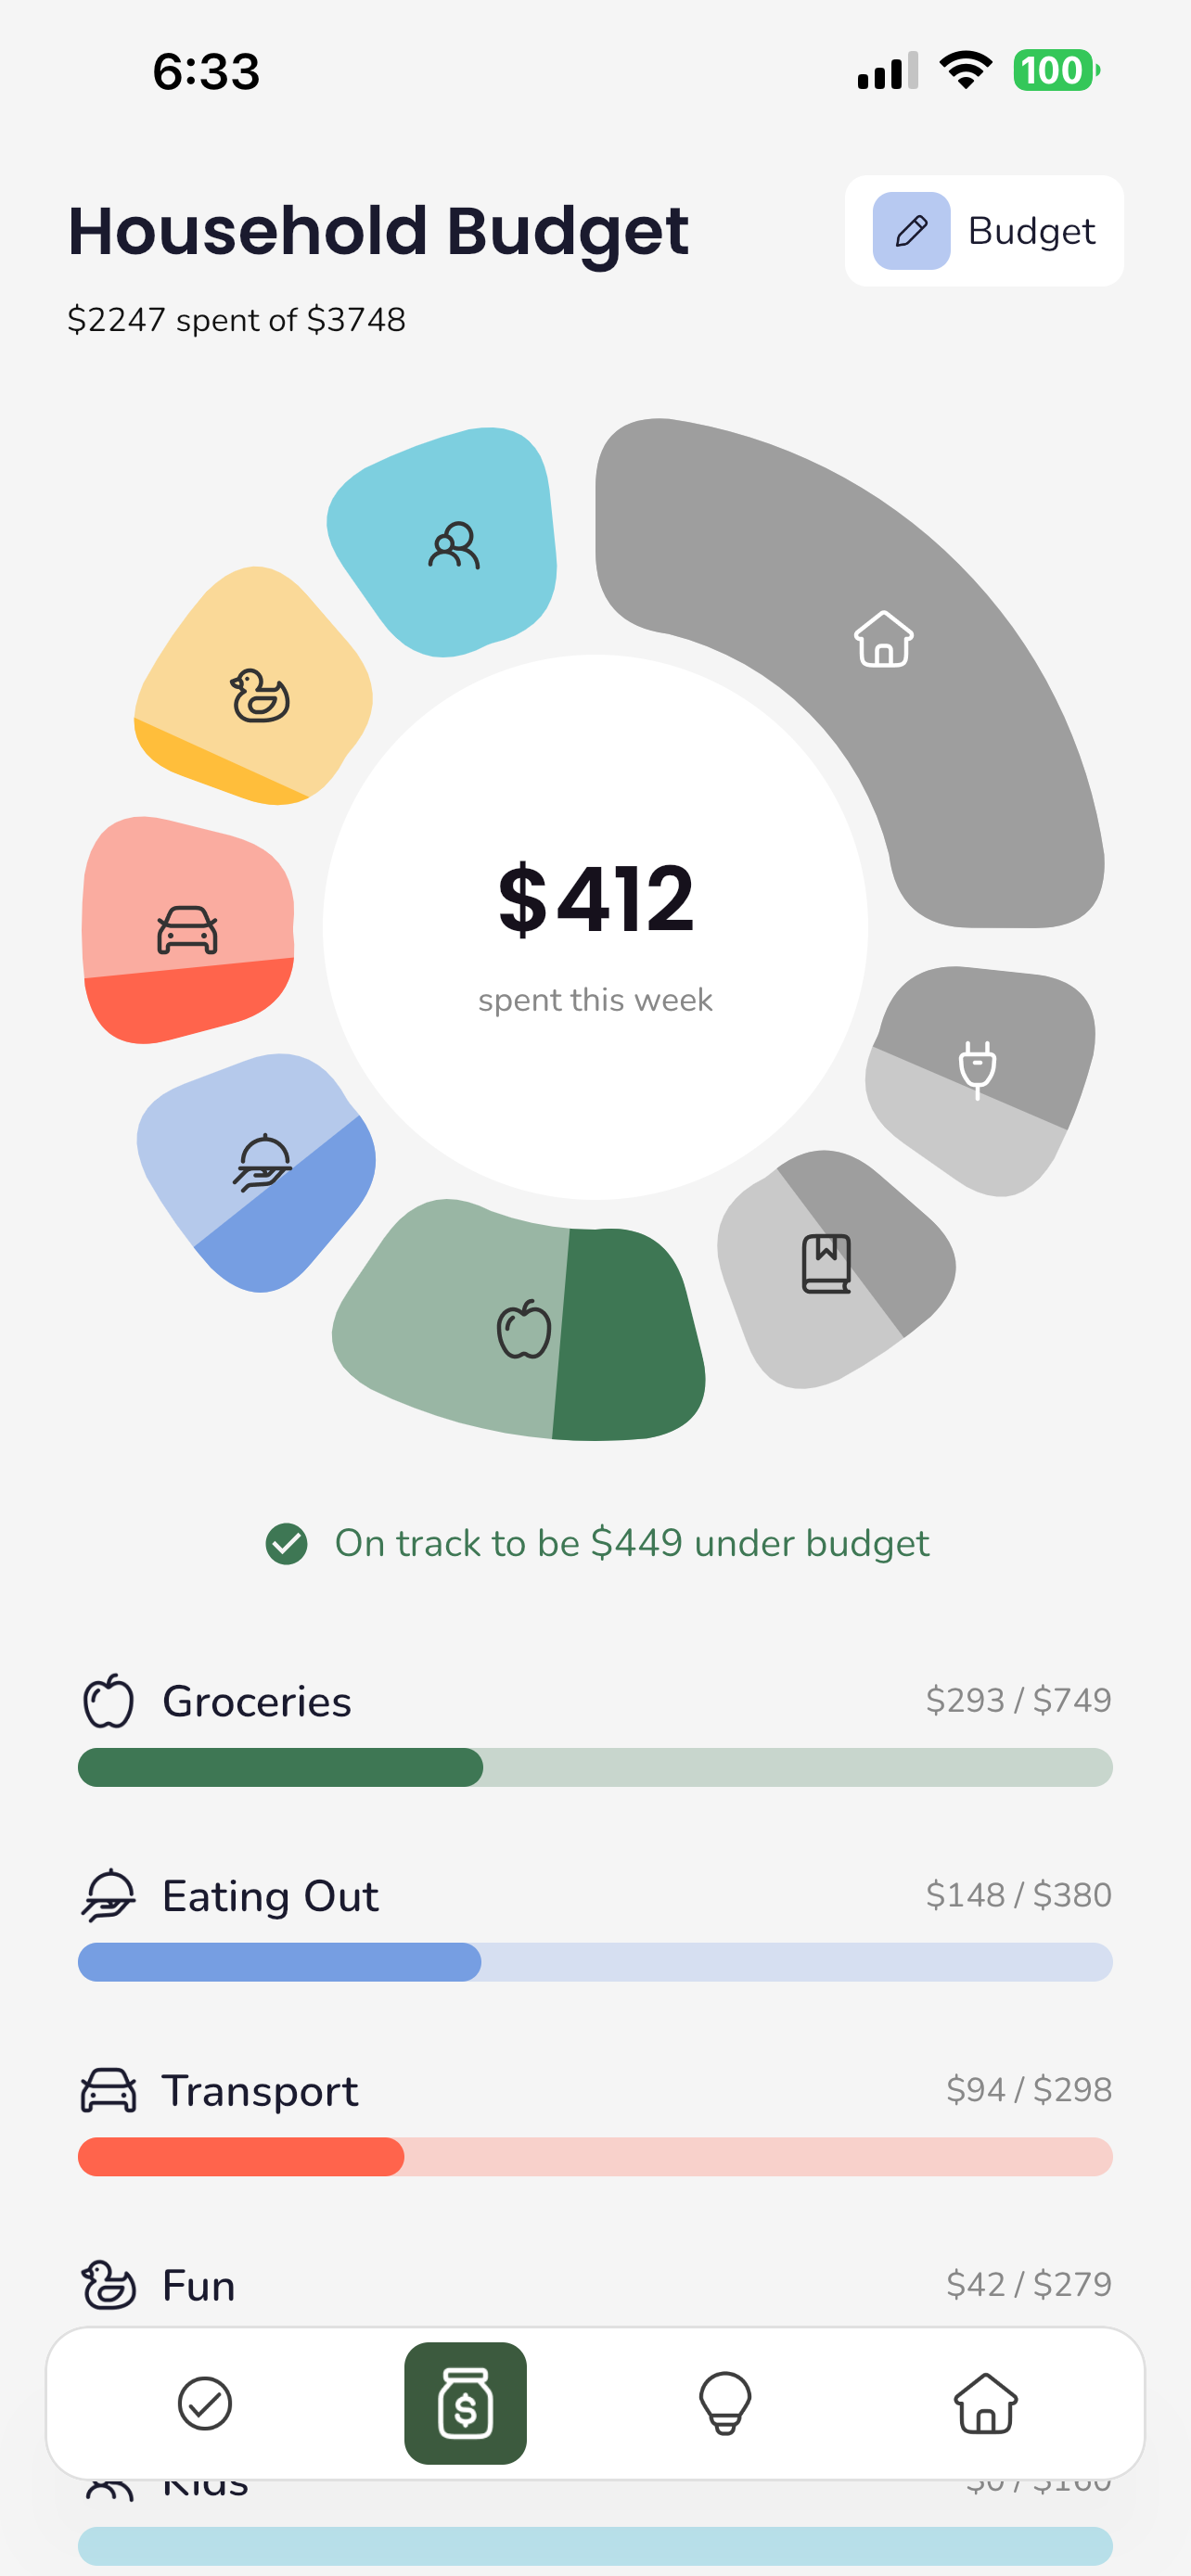
The Spending Wheel
The budget screen's centerpiece is an interactive spending wheel built entirely with Compose's Canvas API. Each category gets a petal-shaped segment sized proportionally to its budget allocation, with a 12% minimum so even small categories stay tappable and readable. The segments are drawn as curved arc paths with quadratic bezier rounded corners, giving them a soft petal shape rather than sharp pie slices.
Each petal has two layers. The background layer renders at 50% opacity showing the full budget allocation. On top of that, a filled layer is clipped to a pie slice representing how much of that category's budget has been spent. So at a glance, you can see both the relative size of each budget category and how far through it you are.
Touch detection uses polar coordinate math. When you tap, the app calculates the distance from center (are you in the ring?) and the angle via atan2 (which segment are you on?), with wrapping logic for segments that cross the -180/180 degree boundary. Tapping a segment highlights it with a stroke border, fills the center circle with that category's color, and swaps the center text to show how much is left in that category. Tapping again deselects.
The entrance animation eases all segments from 0 to their full sweep angle over 800ms. Category icons are positioned at the midpoint of each arc using trigonometry and fade in at 50% progress. Each category has its own color and icon: green apple for groceries, blue fork for eating out, orange car for transport, rubber duck for fun, and so on.
Tech Stack
Client
- Kotlin Multiplatform + Compose Multiplatform - Single codebase targeting Android and iOS. JetBrains' Compose Multiplatform handles the entire UI layer, with platform-specific code only where necessary (notifications, camera, deep links).
- Ktor Client - HTTP networking for API calls, configured per-platform with Darwin and OkHttp engines.
- kotlinx-serialization - JSON parsing across the entire data layer.
- RevenueCat KMP SDK - Cross-platform subscription management and entitlement checking.
- BuildConfig - API keys and environment configuration injected at build time via a Gradle plugin.
Backend
- Supabase - The entire backend: authentication, Postgres database, edge functions, storage for bank statements and receipts, and Row Level Security for data isolation.
- 26 Edge Functions - TypeScript/Deno functions handling everything from transaction categorization to meal suggestions to price comparison. Each function is independently deployable.
- Cloudflare Worker (MCP Server) - A stateless MCP server at mcp.trelliss.app with built-in OAuth 2.0 using
@cloudflare/workers-oauth-provider. Authenticates users via Supabase (with MFA support), gates access by subscription tier, and exposes 30+ tools for AI assistants to interact with user data. - OpenAI - Powers the spending analysis, meal generation, recipe parsing, nutritional analysis, wealth advice, and the financial agent.
Integrations
- Plaid - Bank account linking and transaction syncing via webhooks. Users connect their bank through Plaid Link, and ongoing transaction updates are pushed via webhooks that delegate to the sync function, ensuring every transaction goes through the full categorization pipeline.
- Kroger API - Real grocery pricing with location-specific results.
- Trader Joe's - National product pricing for shopping list comparison.
- Firebase Cloud Messaging - Push notifications including scheduled weekly and monthly status reports.
Architecture
Module Structure
The project is split into two Gradle modules:
- composeApp - The main application module containing all UI, view models, repositories, and data sources.
- dealsource - A separate module handling deal aggregation across multiple retail sources. This was extracted to keep the deal-fetching logic isolated from the main app.
App Architecture
Trellis uses a state holder pattern rather than traditional MVVM. Each screen has a corresponding state class that holds all the data and flags the UI needs. State is composed at the top level and flows down through the component tree.
The data layer follows a repository pattern: repositories abstract over Supabase calls, edge function invocations, and local caching.
Navigation
Navigation is built on Compose Navigation with type-safe routes. All 66 routes are defined as a sealed interface using kotlinx-serialization, so every navigation call is compile-time checked with typed arguments (no string-based routing). The app uses two nav graphs: a root graph with 59 composable destinations covering the full app, and a nested onboarding graph with 10 steps.
The root graph covers four tabs plus every screen reachable from them:
- Home - Weekly spend gauge, onboarding checklist, today's meals, top deals, spending pace, upcoming recurring payments
- Household Budget - Interactive spending wheel, six-state budget messaging, category breakdown, saving goals and history
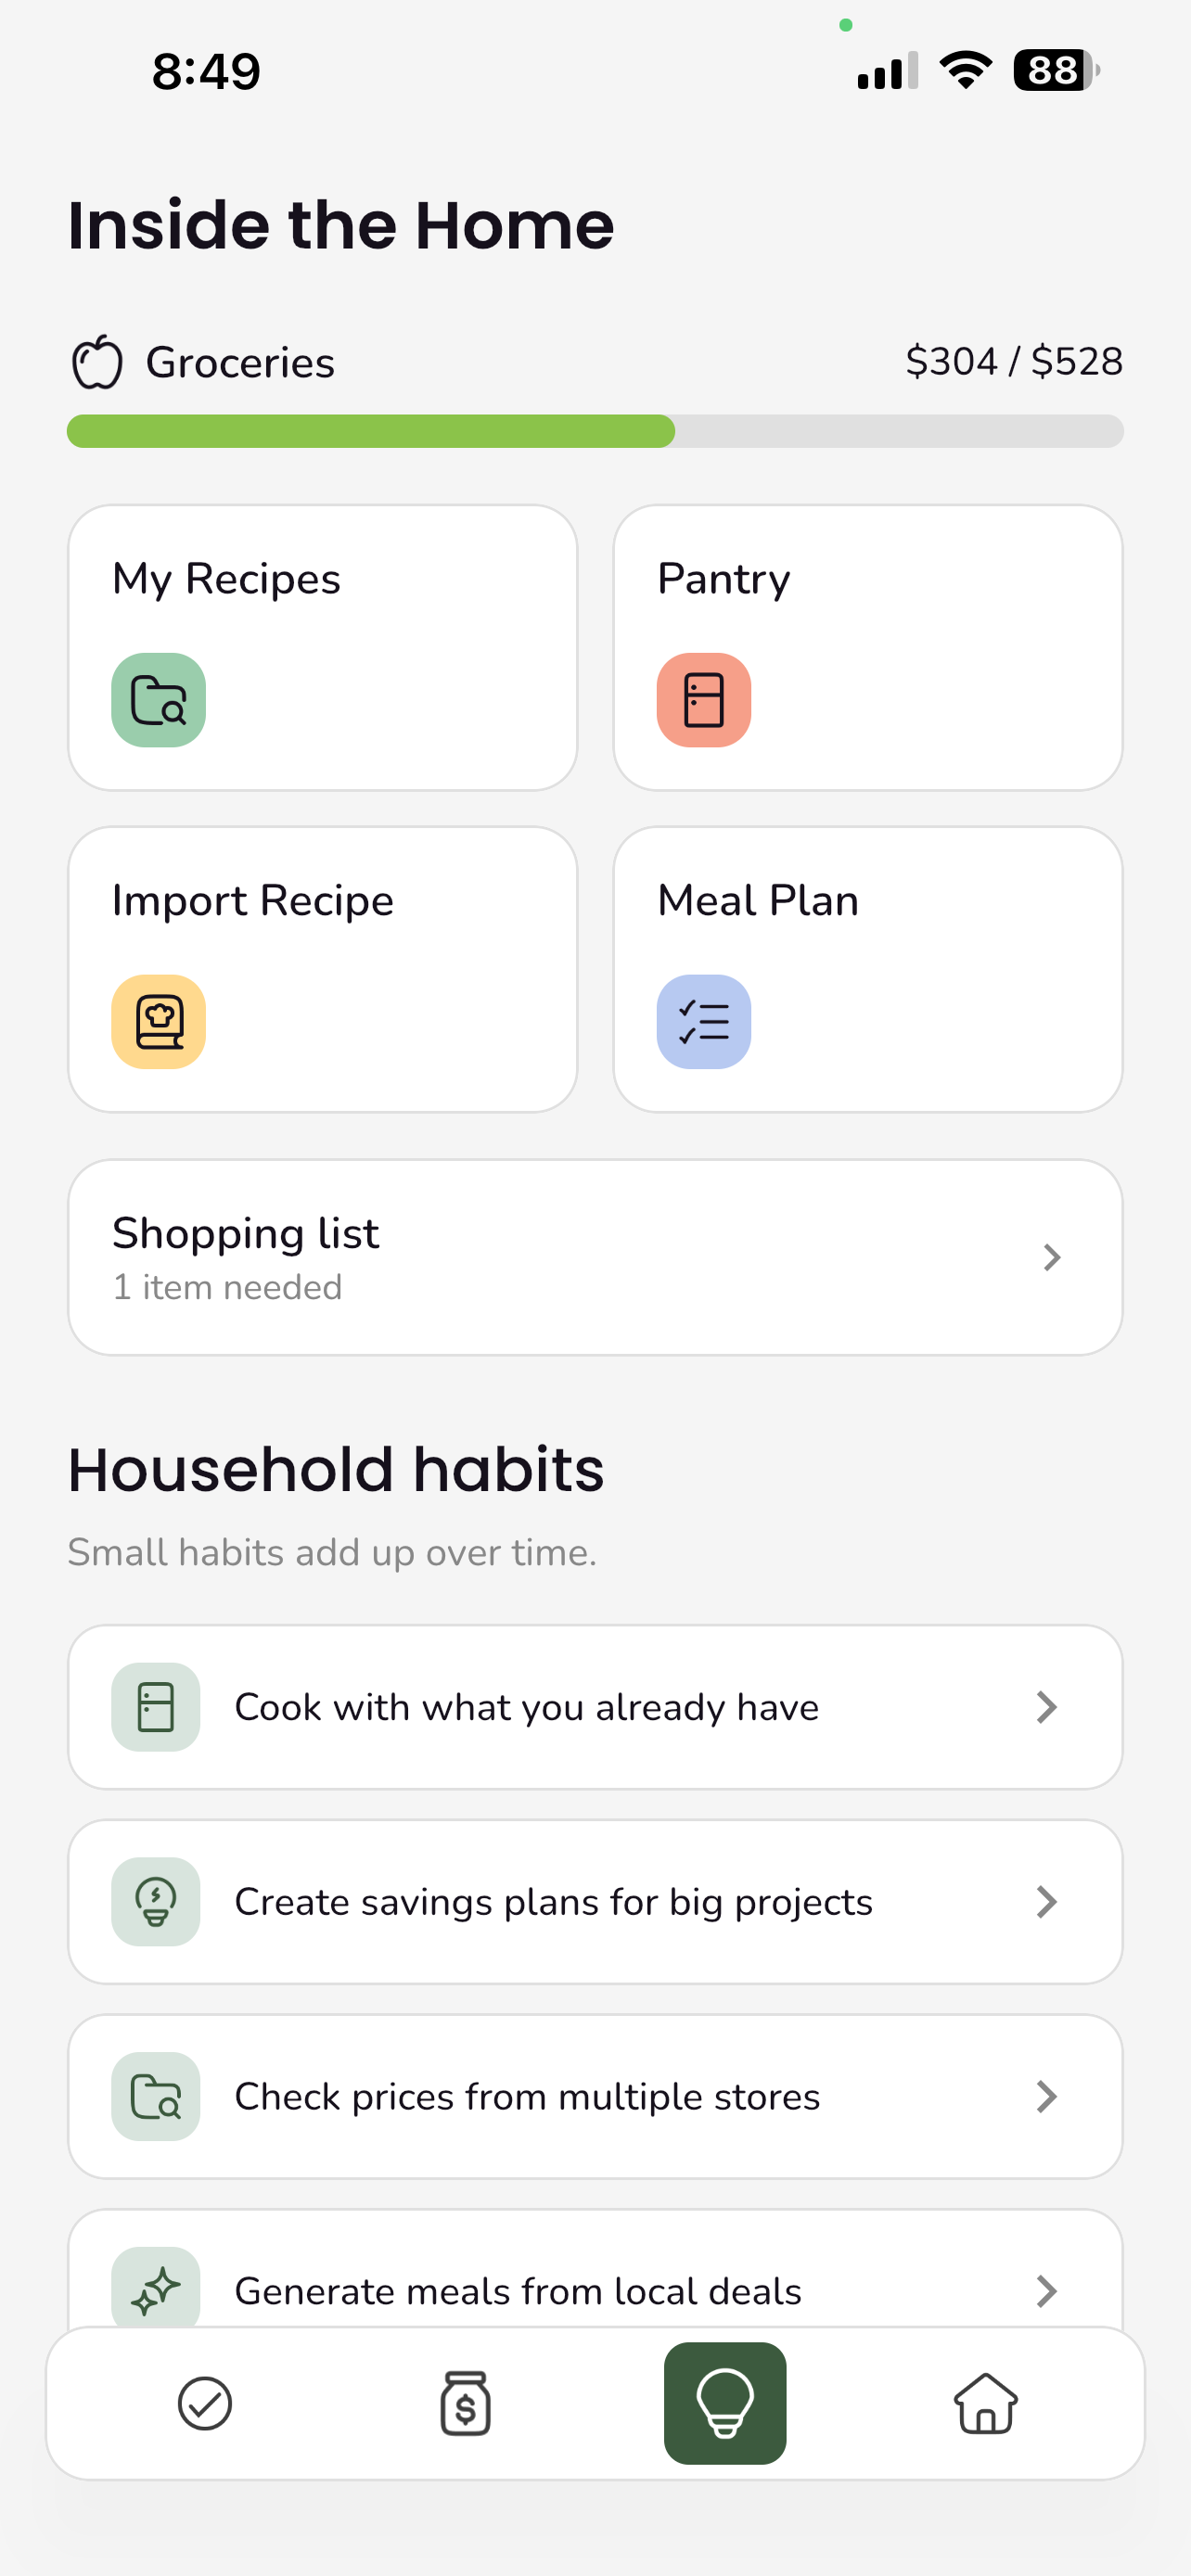
- Inside The Home - Groceries budget bar, action grid (recipes, pantry, import, meal plan), shopping list, household habits
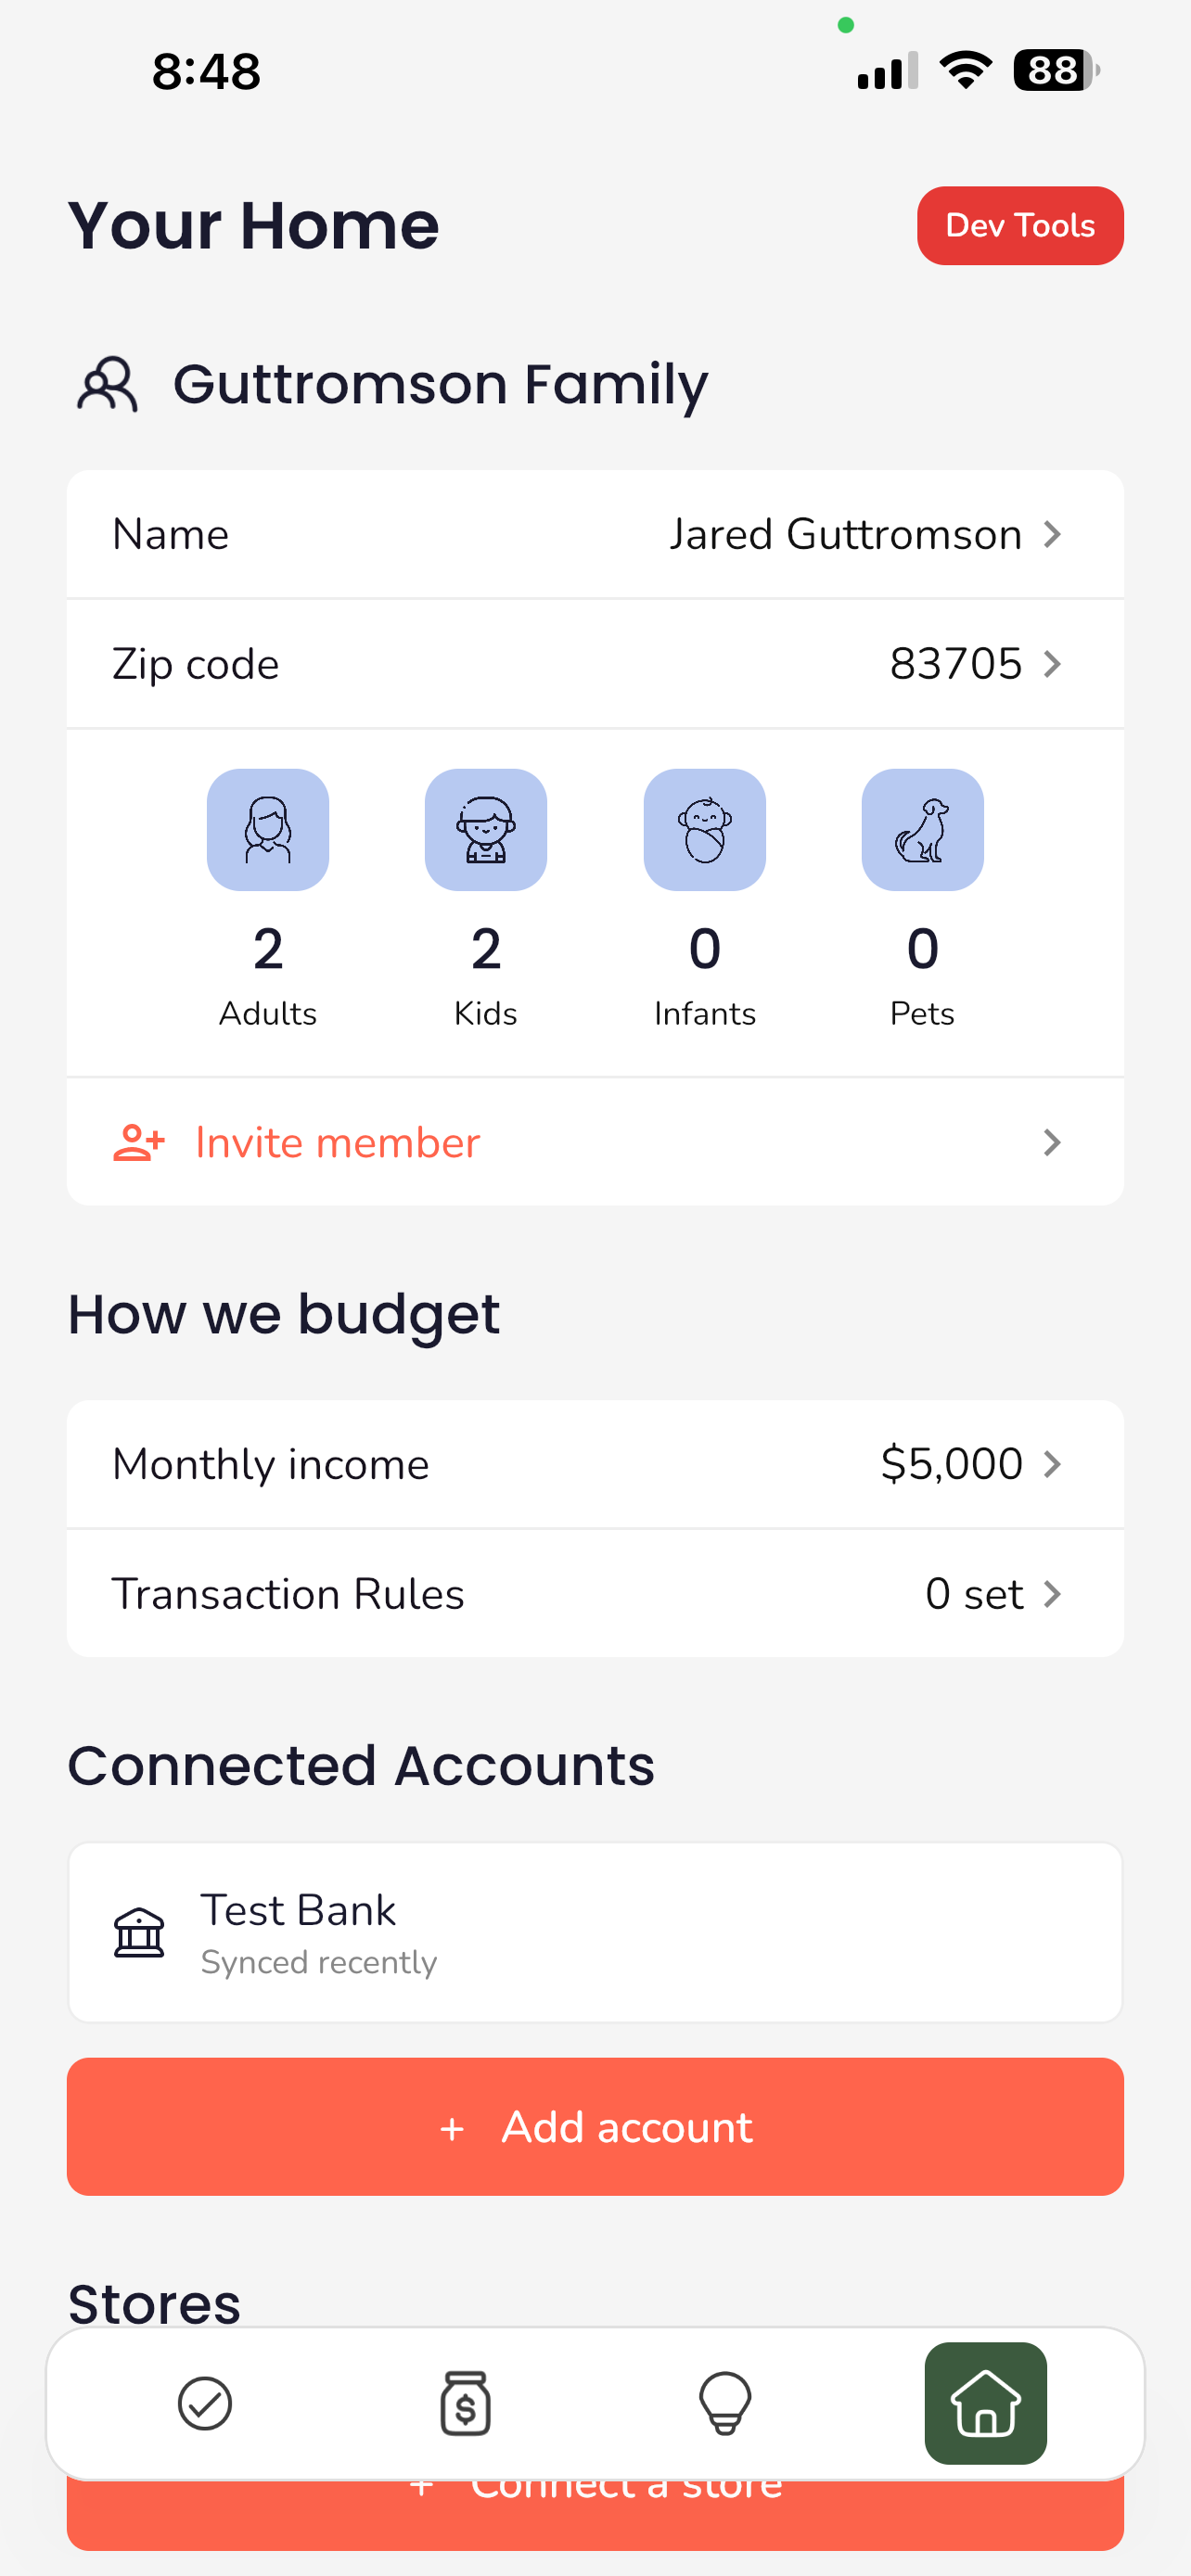
- Your Home (Profile) - Family details, connected accounts, stores, budget settings
Tabs are composed lazily (only when first visited) but kept alive after that, so switching between tabs is instant and state is preserved. The selected tab renders on top with full opacity while others are hidden via a graphics layer alpha toggle.
Data Preloading
During the splash screen, the app kicks off parallel data loads: user profile, budget data, transaction history, meal plans, deals, and subscription status all load concurrently. By the time the user sees the home screen, everything is ready.
Edge Function Pattern
All 26 edge functions follow a consistent pattern. The client sends a JSON request, the function authenticates and processes it, and returns a JSON response. Several functions support dual authentication: user JWT for app calls and service-role key for server-to-server calls (webhooks, crons, function-to-function delegation). This pattern lets a Plaid webhook trigger a transaction sync using the same edge function the app calls directly, without duplicating categorization logic. Functions using dual auth are deployed with JWT verification disabled at the gateway so they can handle auth internally.
RevenueCat Integration
Setup
RevenueCat is initialized on app launch after the user logs in. The SDK is configured with the user's Supabase auth ID so that entitlements are tied to their account across devices.
We use the RevenueCat KMP SDK (v2.5.0), which provides a unified Kotlin API across both platforms. The SDK is configured once on startup and a delegate listens for customer info updates to keep the subscription state in sync.
Subscription Tiers
Trellis has two paid tiers, each mapped to its own RevenueCat offering:
- Essentials - Smart budget tracking, meal and pantry planning, local deal alerts, family teaching view. Available as monthly and yearly plans.
- Family+ - Everything in Essentials plus meal generation and nutrition, store price comparison, unlimited connections, and enhanced budget features. Available as monthly and yearly plans.
On the paywall, prices are pulled directly from RevenueCat so they stay in sync with App Store Connect and Google Play Console without code changes.
Entitlements
Two entitlements drive feature access:
- Essentials entitlement - Grants access to core premium features
- Family+ entitlement - Grants access to everything, including AI-powered features and store comparison
The subscription state is evaluated in a clear priority order: if the Family+ entitlement is active, the user gets Family+ access. Otherwise, if the in-house trial is still active, they get trial access (which grants Family+ level features). If the Essentials entitlement is active, they get Essentials. Otherwise, they're on the free tier.
In-House Free Trial
This is where our implementation diverges from the typical RevenueCat setup. We made a deliberate choice to manage the free trial ourselves rather than using RevenueCat's built-in trial functionality.
The reasoning: RevenueCat trials are tied to a specific product and start when the user subscribes. We wanted something different. When a user signs up and completes onboarding, they get the rest of the current month plus the entire next month with full Family+ access. No credit card required, no subscription commitment. The trial end date is computed as the last day of the next calendar month (sign up February 7th, trial runs through March 31st) and stored in our database.
This gives the app time to prove its value. You need at least one full budget cycle to see spending insights, pace tracking, and the monthly review. Asking someone to commit before they've experienced that felt wrong.
On app launch, the trial end date is loaded from Supabase and checked locally. If the trial is still active and the user hasn't purchased a subscription, they get full Family+ access. When the trial expires, they see a personalized trial-expired screen showing how much they've saved during the trial period, with a clear path to subscribe.
Feature Gating
Feature access is controlled through two access levels that cascade naturally: trial users and Family+ subscribers both have full access, Essentials subscribers have mid-tier access, and free users have basic access.
When a free or Essentials user taps a Family+ feature, an upgrade prompt sheet appears explaining what they'll unlock and linking directly to the paywall. The prompt is non-intrusive, appearing as a bottom sheet rather than blocking navigation.
Developer Mode
To test feature gating in isolation, the app includes a developer mode that can override the subscription state on the fly. This lets us simulate every user scenario without needing real purchases or waiting for trials to expire. The available states:
- Free - Trial expired, no subscription. Basic access only, upgrade prompts on premium features.
- Trial - Active free trial with full Family+ access. The default state for new users.
- Essentials - Paid subscriber with mid-tier access. Budget tracking, meal planning, deal alerts, family teaching view.
- Family+ - Full access. Meal generation, nutrition tracking, store price comparison, unlimited connections.
Each state can be toggled instantly and cleared to restore the real subscription state from RevenueCat. This was essential for verifying that the paywall, feature gating, trial-expired flow, and upgrade prompts all behave correctly across every scenario.
Purchase Flow
When a user decides to subscribe, the flow is straightforward:
- User selects a tier and billing period on the paywall
- The app fetches the latest offerings from RevenueCat
- The correct package is matched by tier (offering) and period (package identifier)
- RevenueCat presents the native purchase sheet (App Store or Google Play)
- On success, the customer info callback fires and the subscription state updates immediately
- The paywall dismisses and the user has instant access to their new features
Restore purchases is also wired through RevenueCat, handling the case where a user reinstalls the app or switches devices.
MCP Server
Trellis exposes a Model Context Protocol (MCP) server that lets AI assistants like Claude interact directly with a user's financial data. Family+ subscribers can connect their Trellis account to any MCP-compatible client and ask questions about their spending, manage their meal plan, update their shopping list, and more, all through natural language.
Architecture
The MCP server is a Cloudflare Worker deployed at mcp.trelliss.app. It uses Cloudflare's @cloudflare/workers-oauth-provider package to handle the full OAuth 2.0 flow, including dynamic client registration, authorization codes, and token exchange. This means any MCP client can connect without pre-registration: the worker handles client registration at /register, authorization at /authorize, and token exchange at /token automatically.
The worker is split into two handlers. The OAuth/auth handler serves the login UI and manages the authorization flow. When a user hits /authorize, they see a branded Trellis login page. After authenticating with their Supabase credentials, the handler checks if MFA is required. If the user has TOTP enabled, they're shown a second form to enter their 6-digit code. Once authentication is complete (with or without MFA), the handler calls completeAuthorization on the OAuth provider, which issues an authorization code and redirects back to the MCP client.
The MCP handler receives authenticated requests at /mcp. The OAuth provider validates the bearer token and injects the user's ID and email into the request context. Before processing any tool call, the handler checks subscription access: the user must have an active Family+ subscription via RevenueCat or an active free trial. If neither is found, the request gets a 403 with a message pointing to the upgrade page.
Each request creates a fresh MCP server instance using the @modelcontextprotocol/sdk. The server is stateless: every request gets its own server, transport, and Supabase client scoped to the authenticated user. After the response is sent, the transport and server are cleaned up via waitUntil.
Tools
The server exposes 30+ tools organized into four groups:
Spending tools cover the full budget workflow. get_transactions returns recent transactions with optional filters by category, date range, and limit. get_spending_by_category aggregates a month's spending into category totals with percentages. get_budget returns the full budget allocation, and get_budget_progress combines budget buckets with actual spending to show remaining amounts and percent used per category, plus how far through the month you are. get_monthly_history pulls spending trends across multiple months. Users can also update_transaction categories (single or bulk by merchant), manage category_rules for automatic categorization, add_budget_category for custom budget buckets, and update_budget allocations.
Meal tools handle the recipe library and weekly planner. get_meals lists recipes with optional type and favorites filters. get_meal_detail returns the full recipe including ingredients, steps, and nutrition. get_weekly_meal_plan returns a complete week organized by day with per-meal ingredients, daily nutrition totals, and weekly cost estimates. Users can add_meal with full ingredient lists, update_meal details, and manage planned_meals on the weekly calendar. The pantry tools (get_pantry, add_pantry_item, update_pantry_item, delete_pantry_item) round out the food management surface.
Shopping tools manage the shopping list. get_shopping_list returns items with estimated totals, filterable by week. add_shopping_list_item adds manual items. rebuild_generated_shopping_list regenerates the list from planned meals minus pantry inventory. complete_shopping_for_week atomically moves checked items into the pantry and clears them from the list.
Dev testing tools are conditionally registered based on a per-user flag or global allowlist. These let QA and development seed realistic test data (budget buckets, transactions, meals with ingredients) tagged with a run identifier, and clean it all up afterward. Each tool supports household context resolution, so a partner account's tools write to the household admin's data.
OAuth Flow
The OAuth implementation is notable because it handles the full flow inside a single Cloudflare Worker without any external auth service. The OAuthProvider wrapper manages client registration, authorization codes, and token exchange using a KV namespace for persistence. The login page is server-rendered HTML styled to match Trellis's brand. MFA support was important since the app requires it for accounts with TOTP enabled: the auth handler stores the intermediate session tokens in hidden form fields between the password step and the TOTP verification step, then resumes the Supabase session to complete MFA verification before issuing the OAuth authorization.
Key Technical Decisions
Why Kotlin Multiplatform
A single codebase for both platforms meant we could build more features in less time. Kotlin compiles to native code on iOS (no JavaScript bridge), so you get real native performance with full type safety from a mature language. Compose Multiplatform handled the UI, and the few platform-specific pieces (camera, notifications, deep links) were isolated with expect/actual declarations. The result is a fully native experience on both platforms with shared business logic, data layer, and UI.
Why Compose Multiplatform
Compose Multiplatform lets you share the UI layer across platforms, not just the business logic. That means every screen, every animation, every component is written once and runs on both Android and iOS. It's declarative, so the UI is a function of state, which makes complex interactive elements like the spending wheel and drag-and-drop recipe management much easier to reason about. And because it's built on top of Jetpack Compose, the Android ecosystem's investment in tooling and documentation carries over directly.
Why Supabase
Supabase gave us auth, database, edge functions, and storage in one platform. The edge functions are particularly important: they run the OpenAI calls, the Kroger API integration, the price comparison algorithm, and the transaction categorization. Moving this logic server-side keeps API keys secure and lets us iterate on the backend without shipping app updates.
Why iOS First
It might seem counterintuitive to launch on iOS first with a Compose Multiplatform app, since Compose is Android-native technology. Two reasons. First, the target audience skews toward iOS. Second, Compose Multiplatform for iOS has matured significantly, and shipping on the harder platform first means Android support comes with less risk, not more. Plus, it's what we had in our pockets.
Why In-House Trials
RevenueCat's trial system is built around subscription products. You start a trial, and if you don't cancel, it converts to a paid subscription. We wanted a different model: give users full access for free, let them experience the value, and then ask them to subscribe. No credit card upfront, no auto-conversion. This required managing trial state ourselves, but the result is a trial that actually gives users enough time to see the impact of the app on their finances.
Infrastructure at a Glance
- 90+ screens including bottom sheets and modals
- 26 edge functions handling backend logic
- 30+ MCP tools across spending, meals, shopping, and dev testing
- 10 unique AI prompts powering spending analysis, meal generation, recipe parsing, wealth advice, and more
- 2 Gradle modules (composeApp + dealsource)
- 4-tab navigation with lazy composition and state preservation
- 2 subscription tiers with monthly and yearly billing
- Cloudflare Worker running OAuth + MCP server at mcp.trelliss.app
- Personalized budget messaging that adapts to your financial situation
- Parallel data preloading during splash for instant home screen
- ~52,000 lines of code across Kotlin and TypeScript
- Cross-platform from a single Kotlin codebase